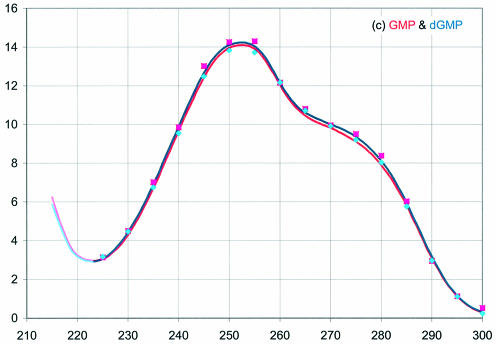
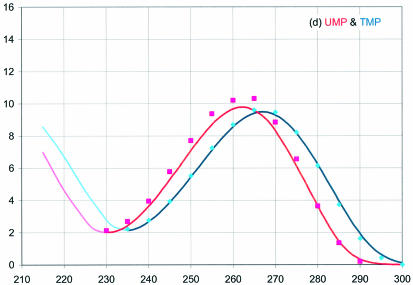
Figure 2.
UV absorbance of the RNA (red) and DNA (blue) 5′-mononucleotides, (a) A, (b) C, (c) G and (d) U and T. This work: dark lines right of the minimum near 230 nm. Squares: spectra from Beaven et al. (6) normalized to ε from Gray et al. (5). Diamonds: spectra from Voet et al. (7) normalized to ε from Gray et al. (5). Light lines at short wavelengths: data from Beaven et al. (6) and Voet et al. (7) normalized at the junction to spectra from this work.


