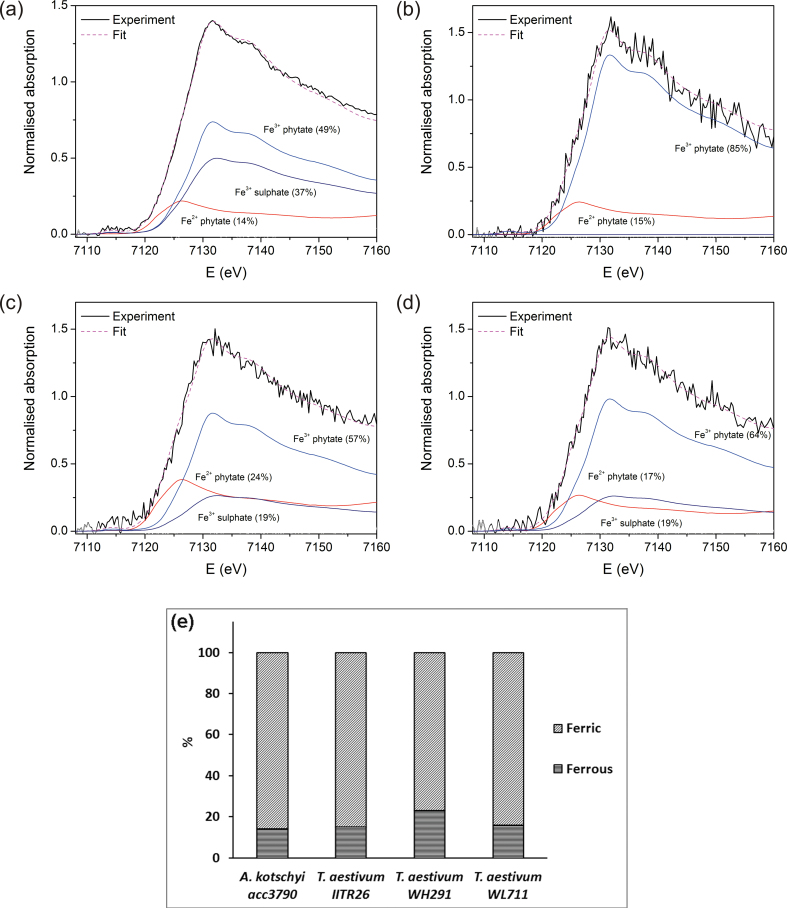
Fig. 5.
(A–D) Fe XANES spectra measured on the intact grains of A. kotschyi acc. 3790 (A), T. aestivum L. IITR26 (B), T. aestivum Cv. WH291 (C), and T. aestivum Cv. WL711 (D). Solid black lines, experiment; dashed magenta line, best-fit linear combination of XANES profiles of Fe(II) phytate, Fe(III) phytate, and Fe(III) sulphate. (E) Proportion of ferric and ferrous iron in the grains (this figure is available in colour at JXB online).

