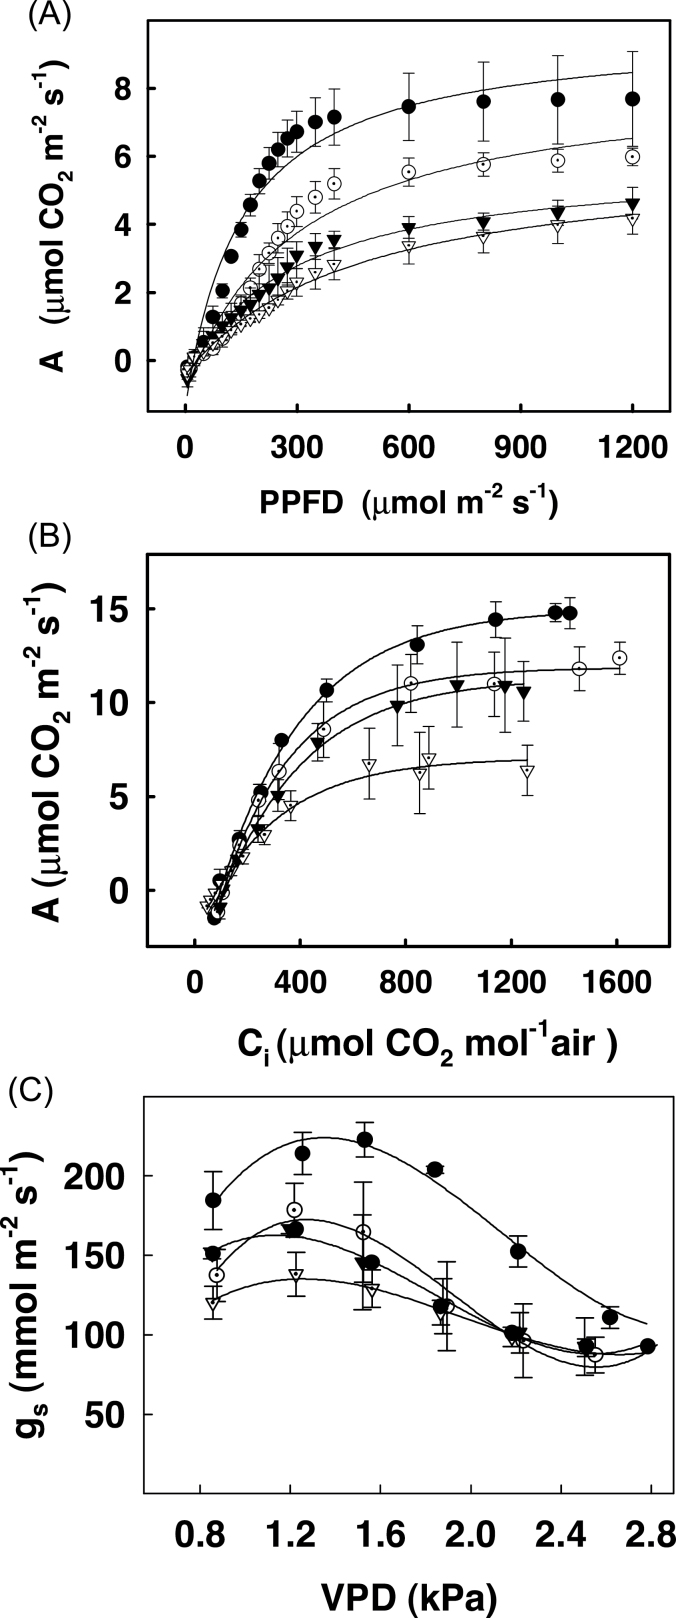
Fig. 3.
Response of net photosynthesis, A, to PPFD (3A) and to sub-stomatal CO2 concentrations Ci, (3B) and that of stomatal conductance gs to VPD (3C) in leaves of control (●), SIERF36–2-2 (O), SIERF36–3-1 (▼) and SIERF36–4-4 (▽) lines of tobacco. Measurements were carried out as described in material and methods. Values are average ± SEs of three to five replicates. Curves were adjusted to a hyperbolic function y=y o + a*x/(b + x) for 3A and 3B and to a non-linear regression for 3C using the equation gs=aVPD3+ bVPD2+cVPD+ d (r2 values ranging from 0.8–0.98).

