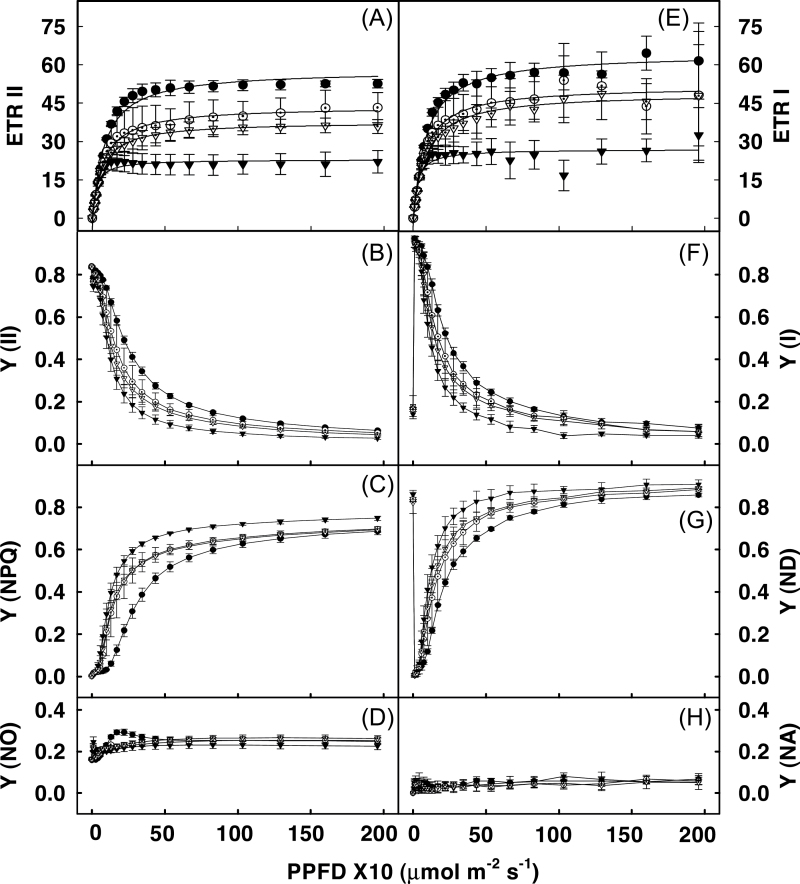
Fig. 4.
Light response curve for electron transport rate of PSII (ETRII) and PSI (ETRI) and their respective quantum yields for leaves of control (●), SIERF36–2-2 (O), SIERF36–3-1 (▼) and SIERF36–4-4 (▽) lines of tobacco. (A) electron transport rate for PSII, ETRII; (B) photochemical quantum yield for PSII, Y(II); (C) quantum yield of light-induced non-photochemical fluorescence quenching for PSII, Y(NPQ); (D) quantum yield of non-light-induced non-photochemical fluorescence quenching for PSII, Y(NO); (E) electron transport rate for PSI, ETRI; (F) photochemical quantum yield for PSI, Y(I); (G) Quantum yield of non-photochemical energy dissipation in PSI due to donor side limitation, Y(ND); (H) Quantum yield of non-photochemical energy dissipation in PSI due to acceptor side limitation Y(NA). Measurements were carried out as described in material and methods at light intensities ranging up to 2000. Values are average ± SEs of three to five replicates. Curves were adjusted to a hyperbolic function y=y o + a*x/(b + x) for A and E.

