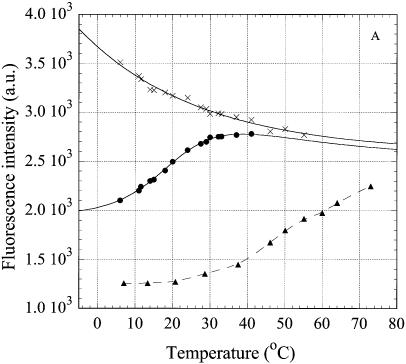
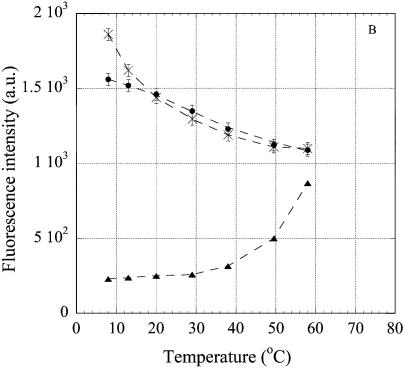
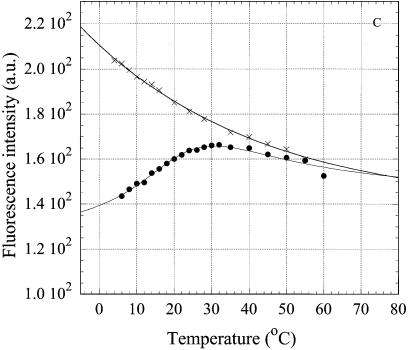
Figure 5.
Temperature dependence of intensity of the fluorescence emission at 370 nm of 2AP, incorporated in the oligonucleotides. The excitation wavelength was 310 nm. (A) oligonucleotides R2APCW (filled circles), R2APC (filled triangles) and R2AP (crosses); (B) control N2APCW (filled circles), ds N2APC (filled triangles), ss N2AP (crosses); (C) oligonucleotides R2APCW-2 (filled circles) and N2APCW (crosses). Solid curves are the best theoretical fits (see Materials and Methods); dashed curves are the smoothed experimental data. Derived thermodynamic parameters are given in Table 1. Solution conditions as in Figure 4.


