Figure 7.
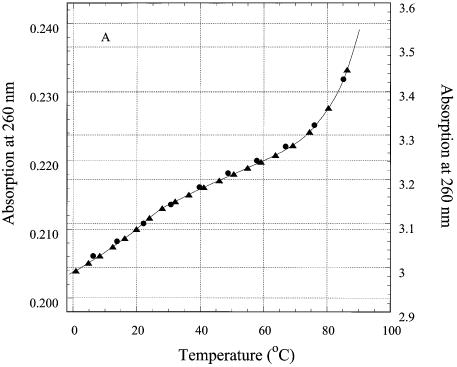
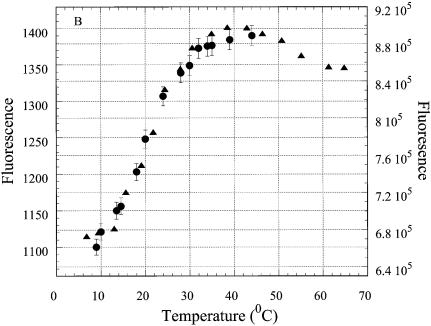
Thermal denaturation of R2APCW at different oligonucleotide concentrations. (A) UV absorption melting profiles. R2APCW concentrations were 0.97 (filled circles) and 12 µM (filled triangles). The 12 µM sample was measured in a 1 mm cell and the plotted OD values are calculated for a 1 cm path. (B) Temperature dependence of 2AP fluorescence in R2APCW at 370 nm: oligonucleotide concentrations were 0.3 (filled circles) and 12 µM (filled triangles).


