Fig. 6.
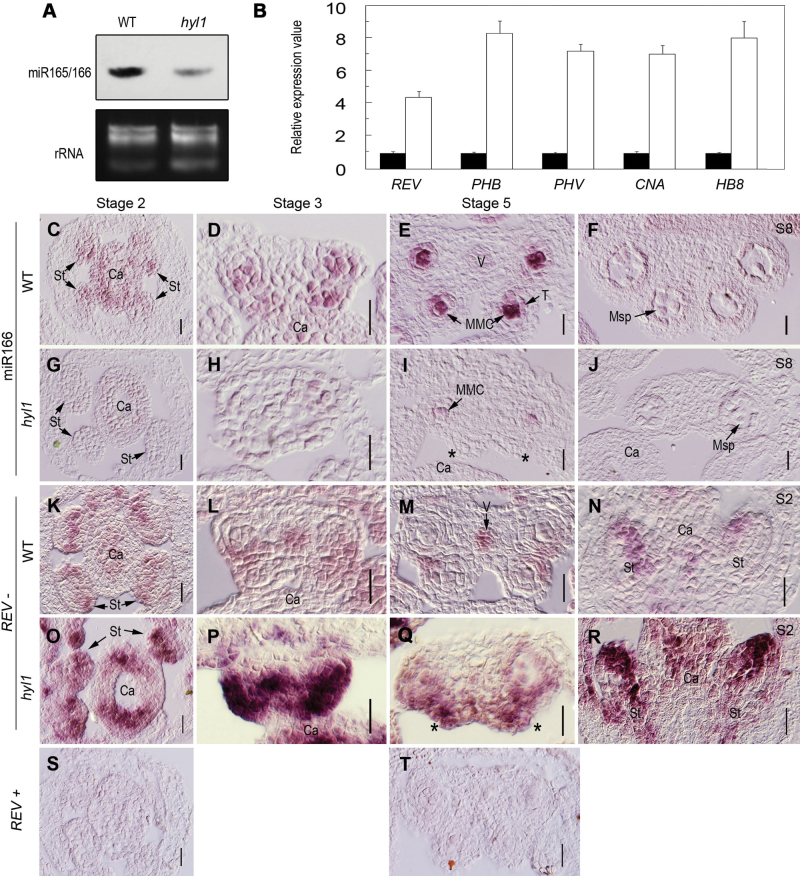
Expression patterns of miR166 and HD-ZIP III genes in hyl1 mutants. (A) Accumulation of miR165/166 in inflorescences of hyl1 mutants shown by northern blotting. (B) Real-time RT–PCR of HD-ZIP III genes in hyl1 anthers at stage 3. Three biological replicates were performed. Error bars indicate the SD. (C–J) In situ hybridization of miR166 with LNA probes. (C–F) miR166 signals in transverse sections of wild-type stamens at stage 2 (C), stage 3 (D), stage 5 (E), and stage 8 (F). (G–J) miR166 signals in transverse sections of hyl1 stamens at stage 2 (G), stage 3 (H), stage 5 (I), and stage 8 (J). (K–R) In situ hybridization of REV. (K–M) REV signals in cross-sections of wild-type stamens at stage 2 (K), stage3 (L), and stage 5 (M). (N) REV signals in a longitudinal section of a wild-type stamen at stage 2. (O–Q) REV signals in cross-sections of hyl1 stamens at stage 2 (O), stage 3 (P), and stage 5 (Q). (R) REV signals in a longitudinal section of a hyl1 stamen at stage 2. (S and T) The sense probe as the negative control. Asterisks indicate the remnants of the inner locule. ca, carpels; MMC, microspore mother cell; msp, microspores; S, anther stage; st, stamens; T, tapetum; V, vascular bundle. Scale bars: 20 μm in C–T.

