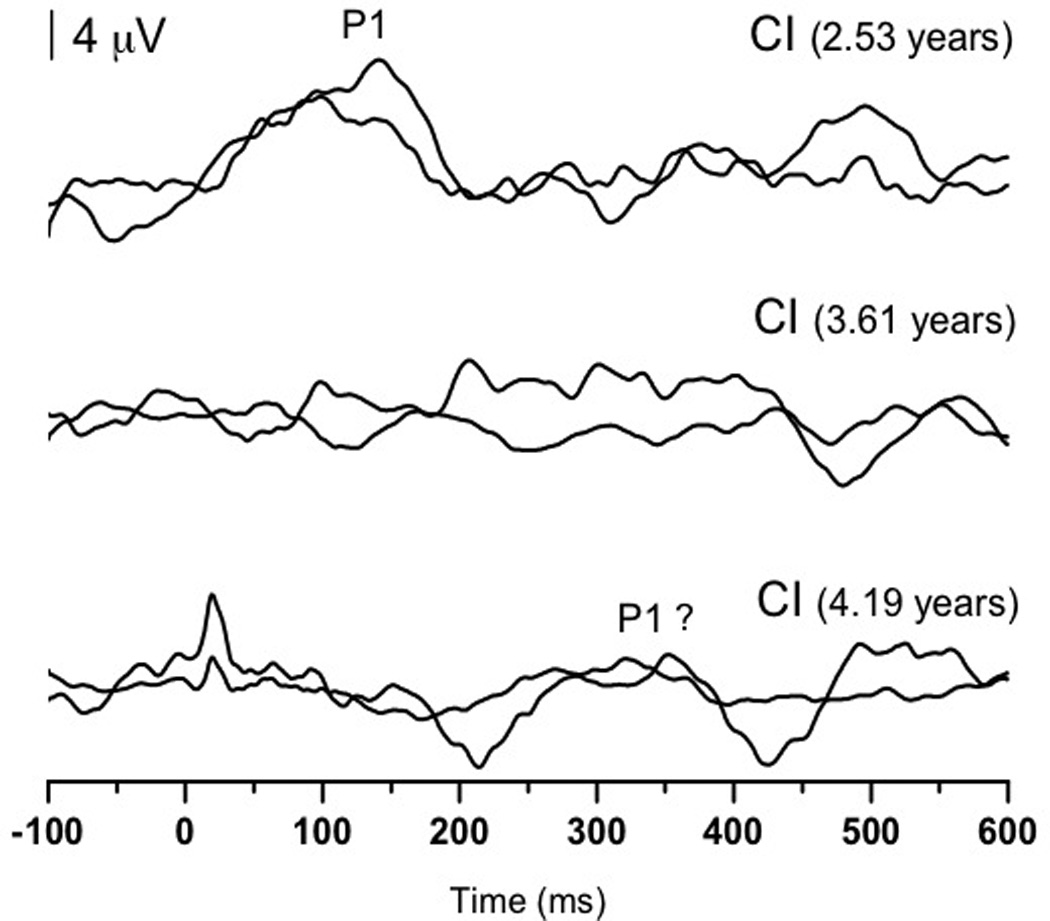
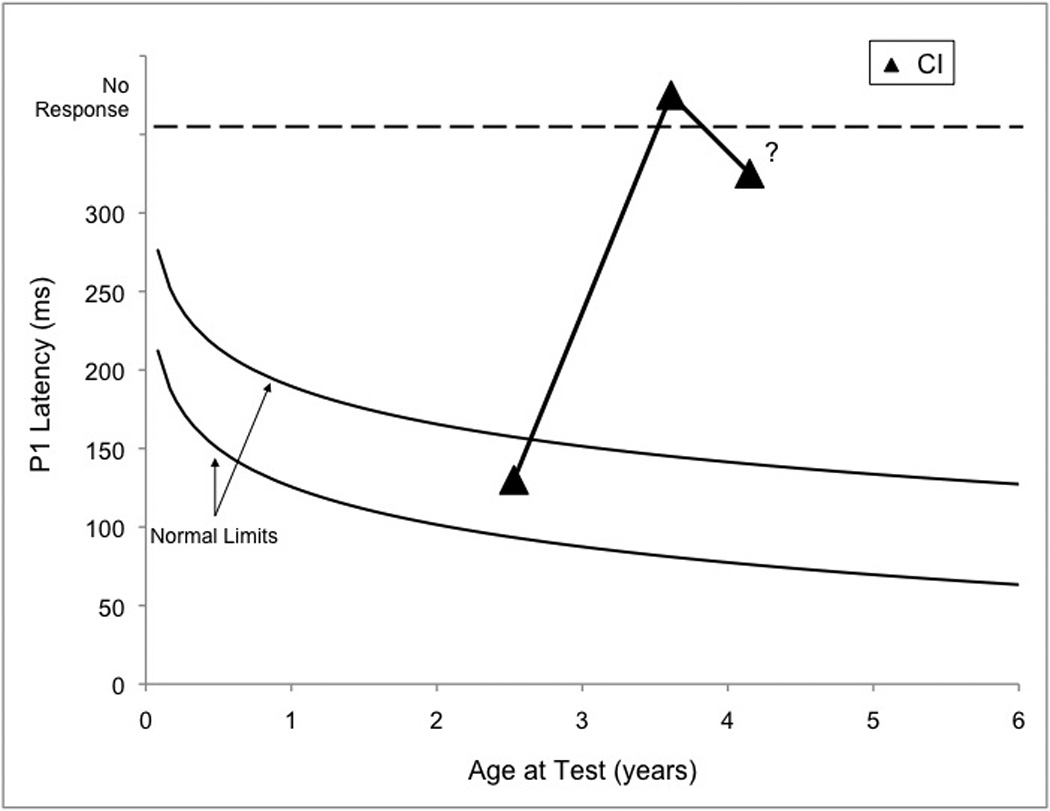
Figure 3.


(Panel A): P1 CAEP waveforms (with replications) for three testing sessions (2.53, 3.61, and 4.19 years of age) performed with cochlear implants for Case 3 (RB). Testing at: 2.53 years (top) shows replicable and robust P1 responses; at 3.61 years (middle) show no replicable response; at 4.19 years (bottom) show a somewhat replicable response. (Panel B): P1 latencies from three testing sessions (closed triangles) plotted by age and compared to the 95% confidence intervals for normal P1 latency development (Sharma et al., 2002c). Testing at 2.53 years of age revealed responses with normal latencies, while testing at 3.61 and 4.19 years of age yielded no response and a marginally replicable P1 response that was delayed in latency, respectively.
