
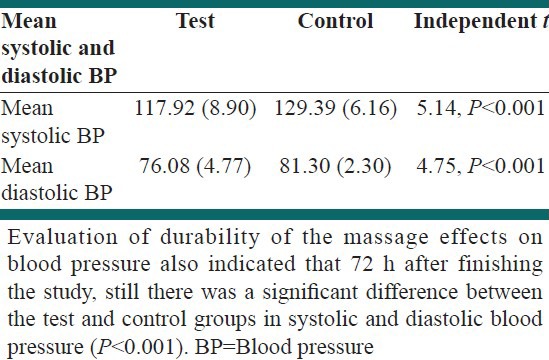
Table 3.
Comparing the average systolic and diastolic blood pressure in the test and control groups 72 h after the study
Official websites use .gov
A
.gov website belongs to an official
government organization in the United States.
Secure .gov websites use HTTPS
A lock (
) or https:// means you've safely
connected to the .gov website. Share sensitive
information only on official, secure websites.
Comparing the average systolic and diastolic blood pressure in the test and control groups 72 h after the study