. 2013 May;4(5):538–545.
Copyright: © International Journal of Preventive Medicine
This is an open-access article distributed under the terms of the Creative Commons Attribution-Noncommercial-Share Alike 3.0 Unported, which permits unrestricted use, distribution, and reproduction in any medium, provided the original work is properly cited.
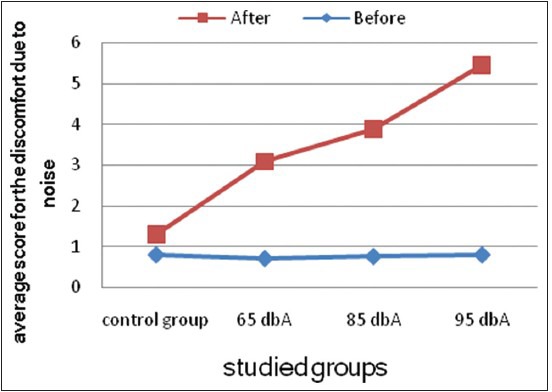
Graph 1.

Comparison of the average score for the discomfort
