
Graph 4.
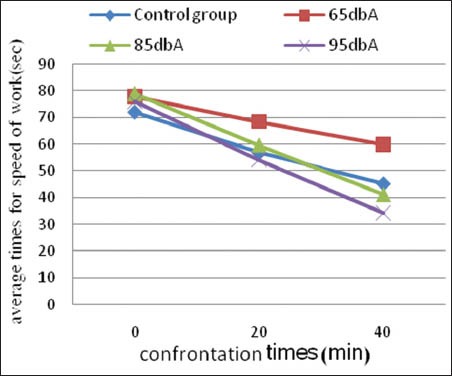
Comparison of the average times for speed of work and sound confrontation times in studied groups
Official websites use .gov
A
.gov website belongs to an official
government organization in the United States.
Secure .gov websites use HTTPS
A lock (
) or https:// means you've safely
connected to the .gov website. Share sensitive
information only on official, secure websites.
Comparison of the average times for speed of work and sound confrontation times in studied groups