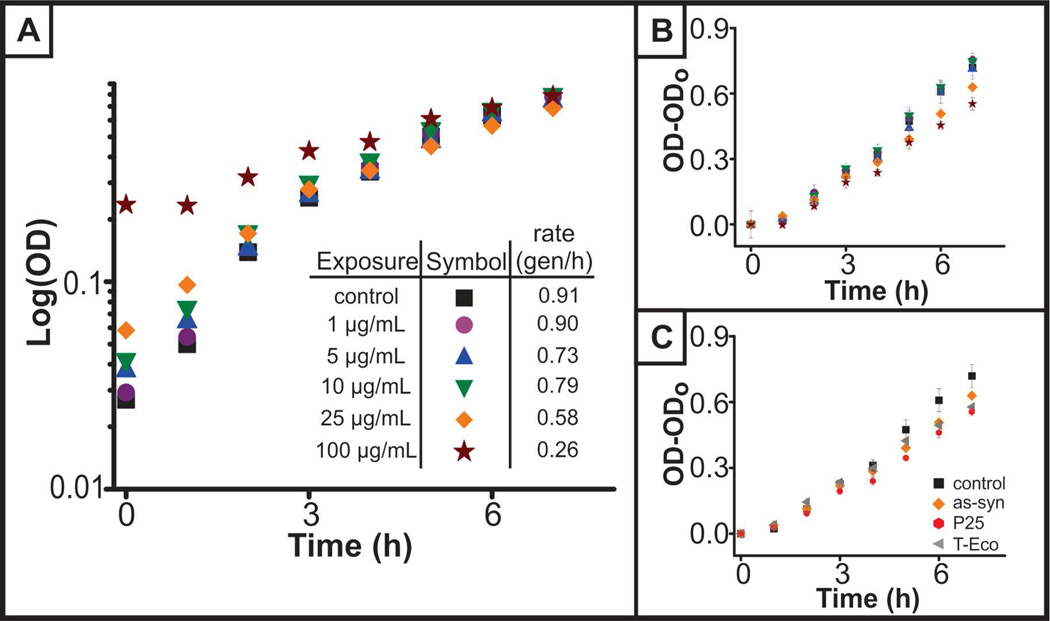
Figure 1.
Growth of S. oneidensis in the presence of TiO2 nanoparticles. (A) Exponential phase of bacteria grown in the presence of varying concentrations of as-syn TiO2 nanoparticles. Inset indicates growth rate of bacteria as determined by Equation 4.1. (B) Exponential phase of growth, with optical density at time = 0h subtracted to take into account scattering from as-syn nanoparticles. Statistical analysis of the linear regression of control and nanoparticle-exposed S. oneidensis revealed that all concentrations of nanoparticle-exposure regressions are statistically different than the control (p<0.001). (C) Comparison of the growth of S. oneidensis in the presence of 25 µg/mL as-syn, P25, or T-Eco nanoparticles.

