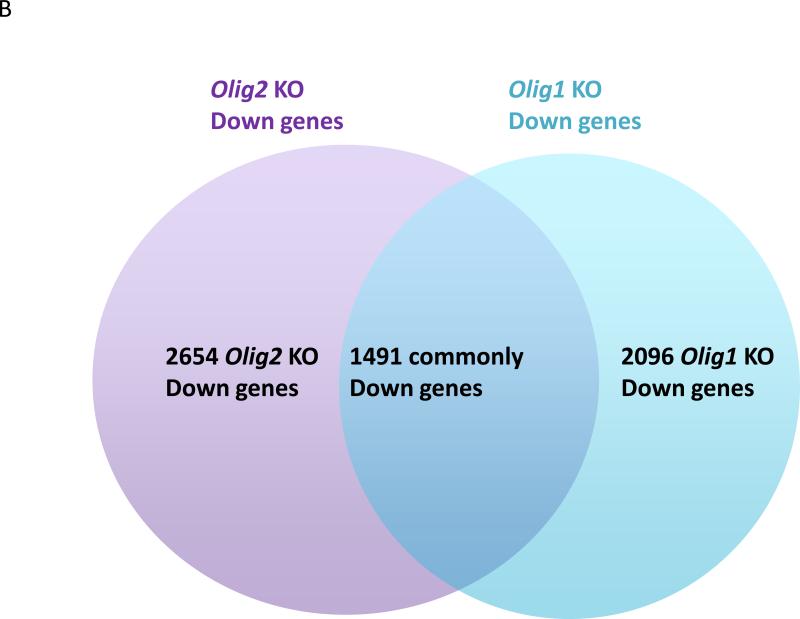
Figure 3. OLIG1 and OLIG2 downstream gene targets.
The gene sets regulated by OLIG1 and OLIG2 only partially overlap. a | The number of genes that show upregulated expression in Olig1 and/or Olig2 null neural progenitor cells compared with wild-type neural progenitor cells. b | The number of genes that show down-regulated expression in Olig1 and/or Olig2 null neural progenitor cells compared with wild-type counterparts. The Olig2 data set is taken from REF. 39, whereas the Olig1 expression profiling data sets (S. Mehta, H. Liu, J. Alberta, E. Huillard, D. Rowitch, C. Stiles, unpublished observations) are available from the NCBI GEO database (GSE39706).


