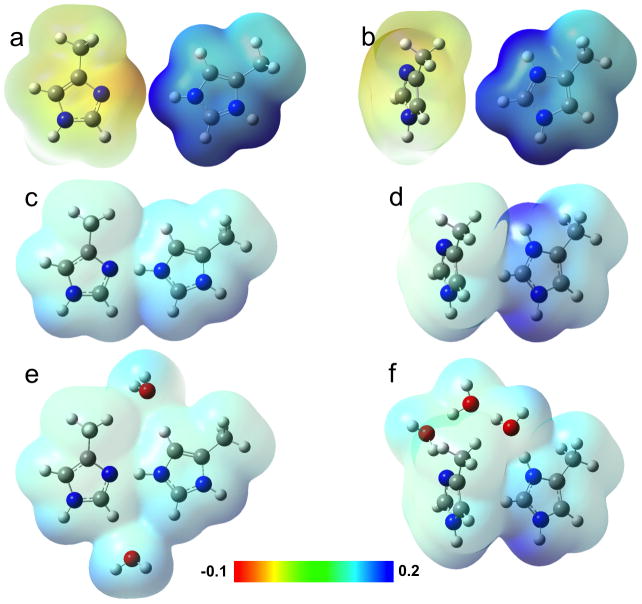
Fig. 5.
Contrasting charge distributions in D2 and D1. In (a) and (b), electrostatic potential surfaces calculated separately for an imidazole (left) and for an imidazolium (right) are arranged in the orientation of a pair in D2 or D1, to serve as references. The corresponding surfaces of an imidazole-imidazolium dimer in D2, without and with two surrounding water molecules, are shown in (c) and (e); those of a pair of neighboring imidazole and imidazolium in D1, without and with three water molecules at the top, are shown in (d) and (f). The electrostatic potentials are displayed on the isodensity surface; the scale is in atomic units.

