
Figure 2.
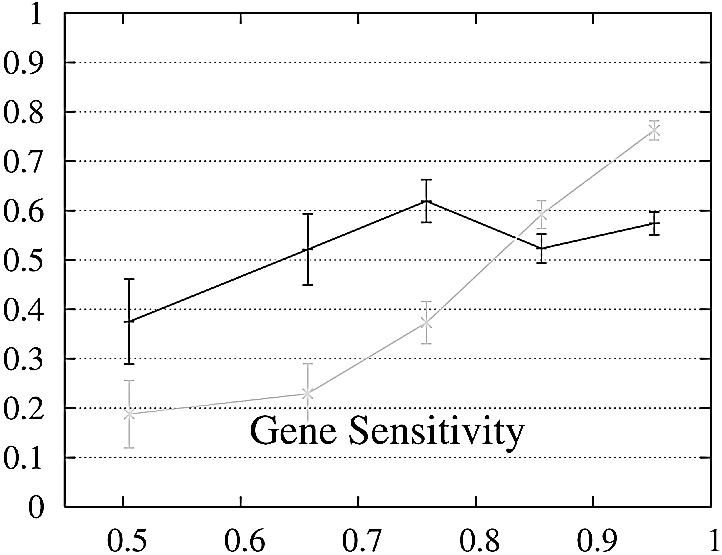

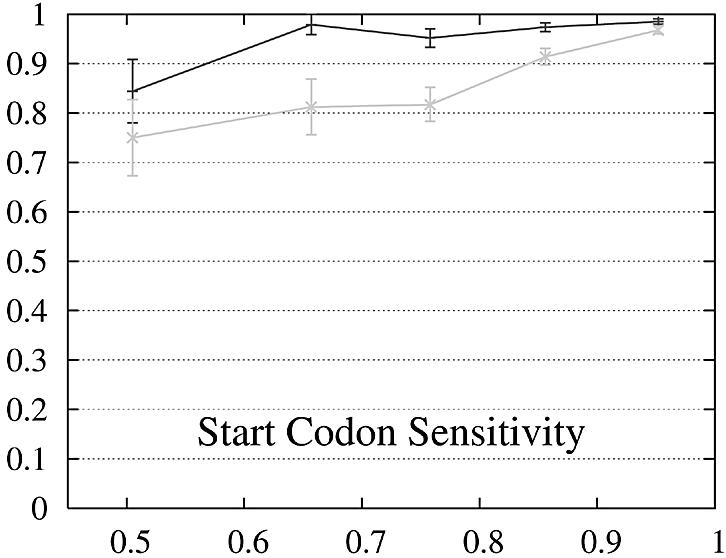
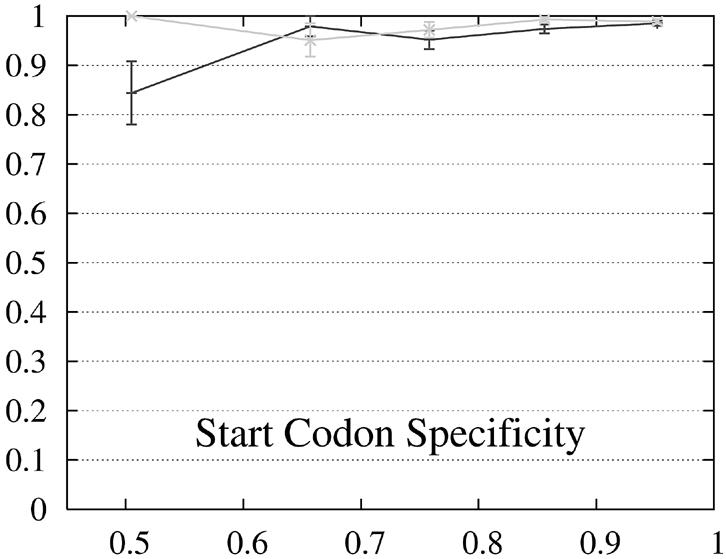
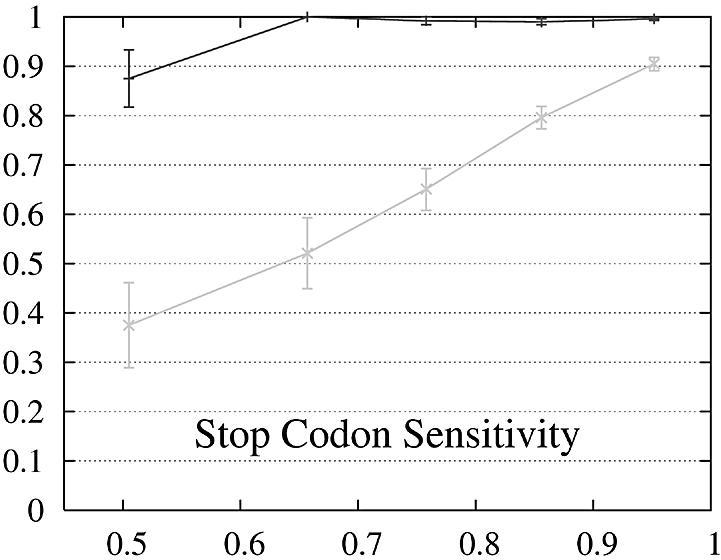
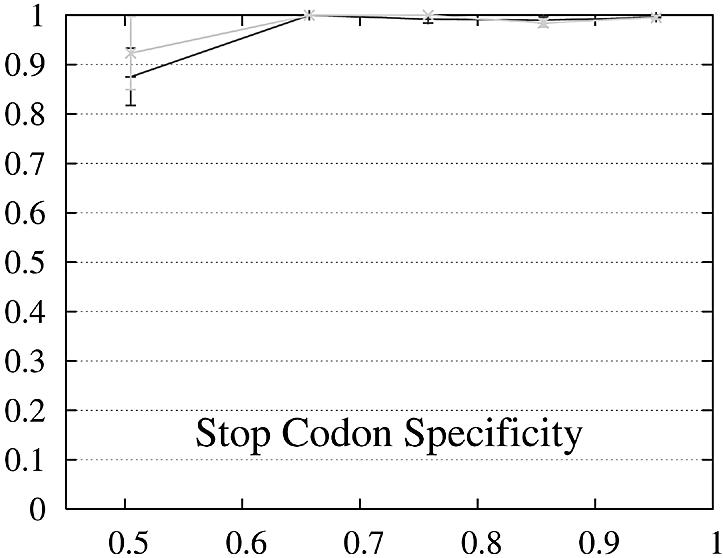
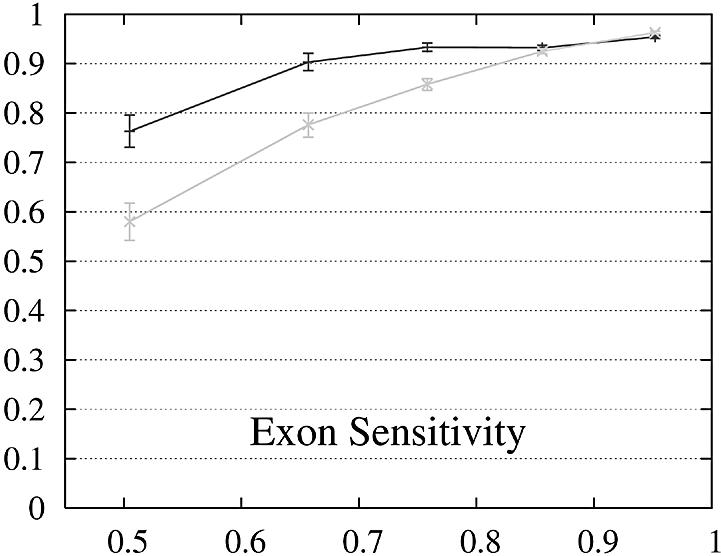
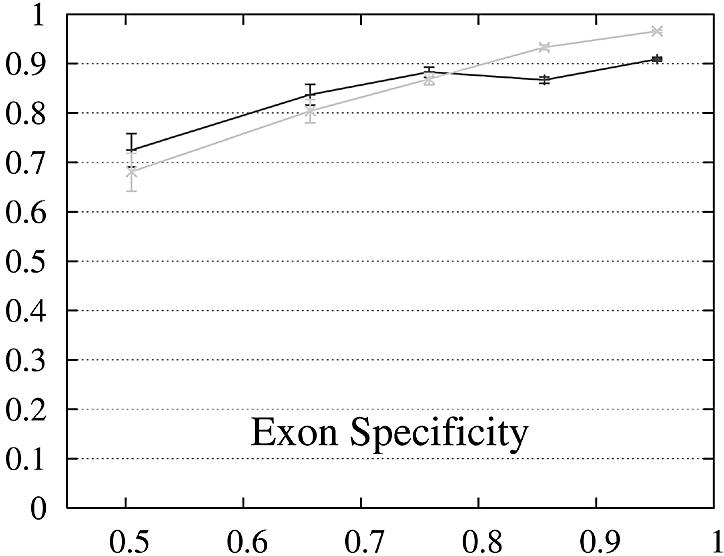
Performance of Genewise (gray) and Projector (black) as a function of the percent identity between the two protein sequences encoded in each pair of related genes. For each of the protein percent identity intervals (0, 0.6, 0.7, 0.8, 0.9, 1), the data point is drawn at the average percent identity of the protein pairs contained in that interval (the numbers of genes in the intervals are 32, 48, 126, 304 and 472, respectively). The errors indicate the statistical error of the performance value and correspond to one standard deviation. Please refer to the text (Results, section Performance) for the definition of sensitivity and specificity.