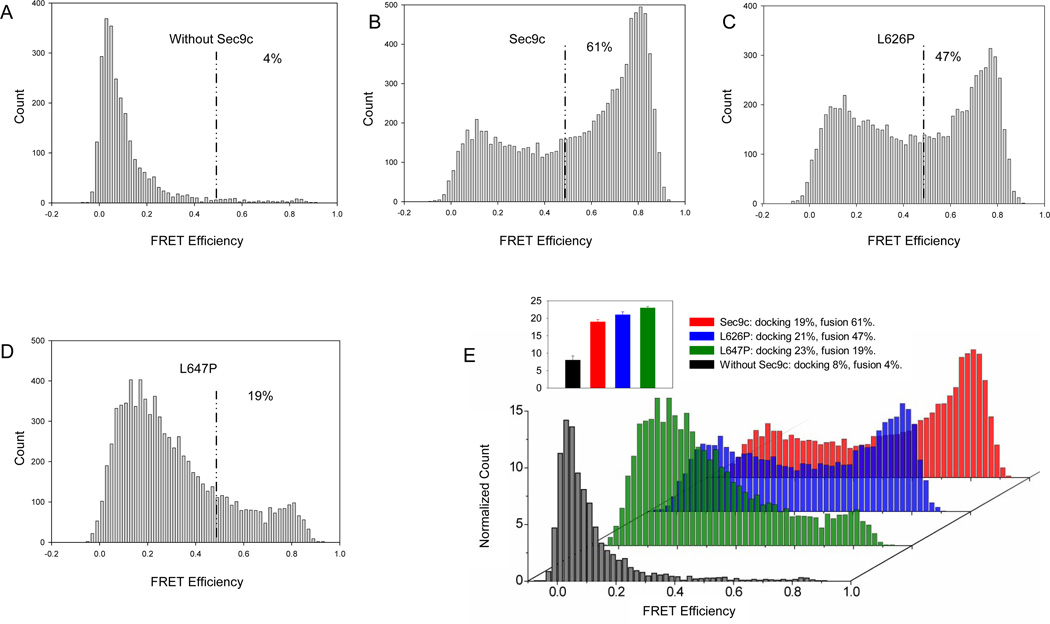
Figure 5. Single Vesicle Assay of SNARE –Mediated Docking and Membrane Fusion.
Single vesicle assay was performed between surface tethered v-SNARE vesicle (acceptor dye) and non-tethered t-SNARE vesicle (donor dye) with Sec9c and its proline mutants. Histograms represent the distribution of FRET signals from v- and t-SNARE vesicle mixing (after 20 min incubation). The vesicle populations showing FRET efficiency below 0.5 and above 0.5 were assigned to be unfused and fused population, respectively (Yoon et al., 2006). The ratio between Sec9c (or praline mutant) to Sso1pHT was 1:1. These histograms were built by combining data from 26–44 imaging locations and by analyzing 2507–9390 vesicles.
(A to D) The distribution of the FRET efficiency in the absence of Sec9c (A), in the presence of Sec9c (B), L626P (C) and L647P (D).
(E) 3D overlay of histograms normalized to count per imaging area allows direct comparison and clearly shows the decrease of fused population as a result of helix disruption of SN2.
(Inset) the bar graph representing the docking probabilities for the wild-type and the proline mutants of Sec9c measured at t = 20 min.

