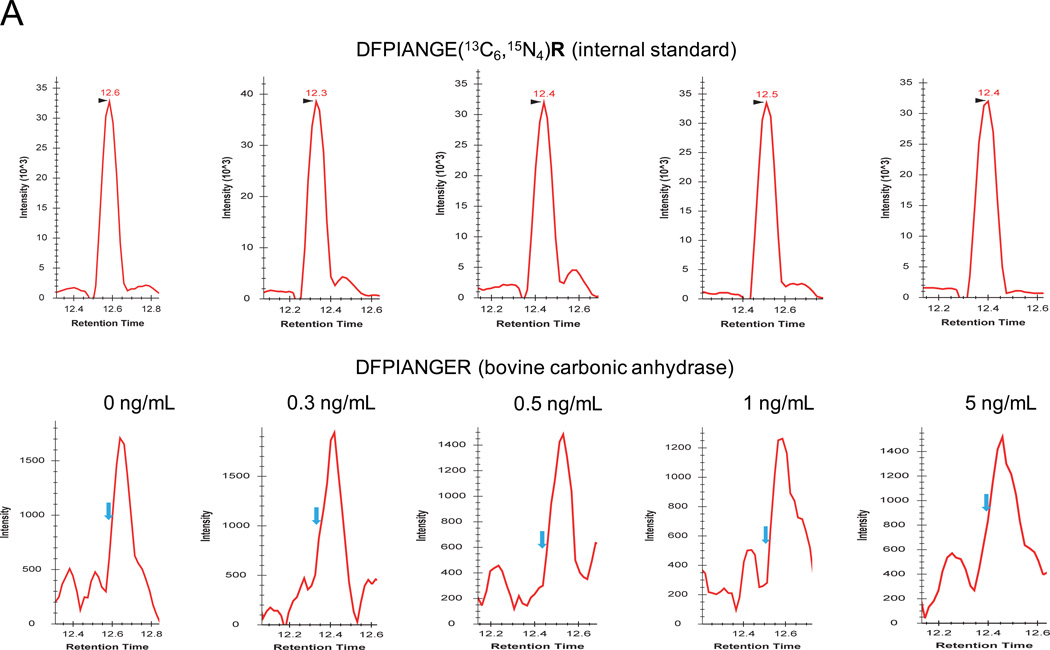
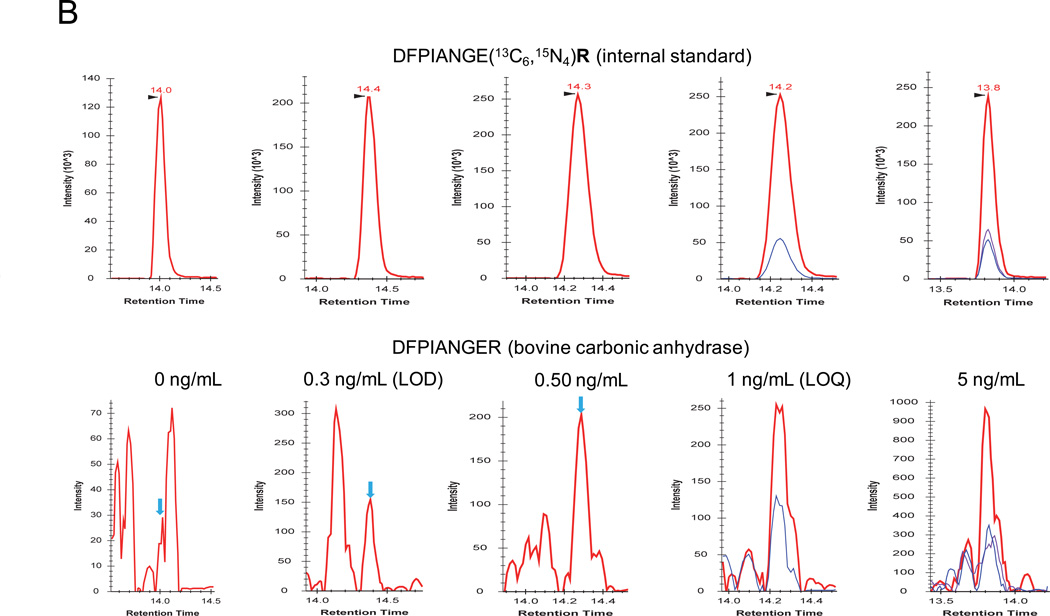
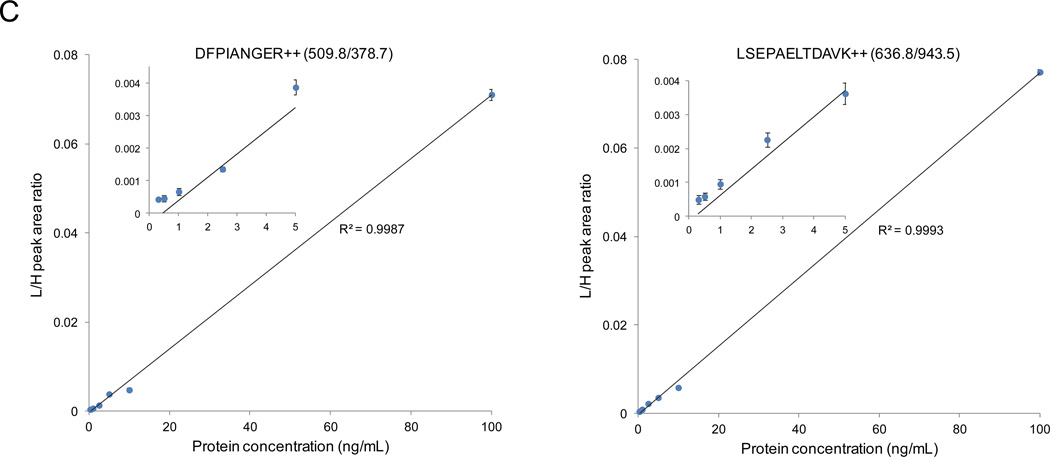
Figure 2.
Sensitivity, reproducibility, and accuracy of PRISM-SRM assay. XICs of transitions monitored for DFPIANGER derived from bovine carbonic anhydrase at various concentrations: (A) without PRISM fractionation; (B) with PRISM fractionation. DFPIANGER: 509.8/378.7 (red), 509.8/756.5 (blue), 509.8/546.3 (purple). Internal standards were spiked in at 0.5 fmol/µL. The blue arrows indicate the locations of expected SRM peak of light peptides based on the retention time of heavy internal standards. (C) Calibration curves for quantifying bovine carbonic anhydrase and PSA.


