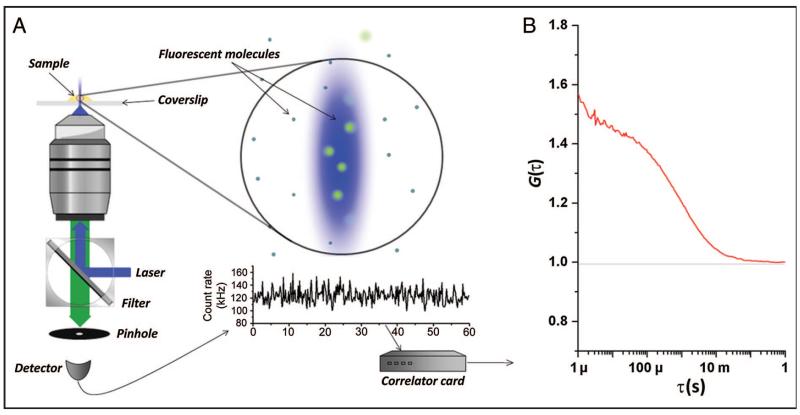
Fig. 1. Fluorescence correlation spectroscopy: setup and FCS curve.
(A), Typical FCS setup. Excitation light (blue) from a laser reflects off the dichroic mirror and is focused by an objective lens. Fluorescent molecules are excited in the observation volume, and emitted light (green) is collected and directed toward the detector. Signal from the detector is autocorrelated by the correlator card. The output generated is an FCS curve. (B), Typical FCS curve. The autocorrelation variable, G(τ), is plotted as a function of the correlation time, τ. The curve can be fitted to a statistically derived model of fluctuations. G(0) is the extrapolated value of G at τ = 0, inversely proportional to the number of molecules in the observation volume and therefore concentration. The time at which G(τ) is roughly one-half of G(0) is the mean residence time in the observation volume.

