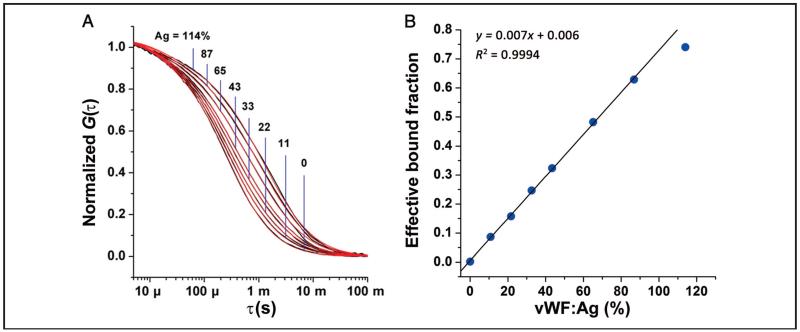
Fig. 2. vWF:Ag dilution study.
(A), Correlation curves from dilutions of a healthy control (—, black) show a progressive shift to shorter diffusion times at lower antigen concentrations (each curve is labeled with corresponding vWF:Ag concentration in % units). A global fit to a 2-component standard FCS equation with the fast-diffusing component fixed at the τd of the free antibody is shown as red lines (—), which largely overlap the black correlation curves. (B), The resulting effective bound fraction component, plotted against the actual vWF:Ag concentration (%), shows a near-perfect linear correlation for antigen concentrations from 0% to 90%, beyond which the bound fraction component approaches total antibody concentration.

