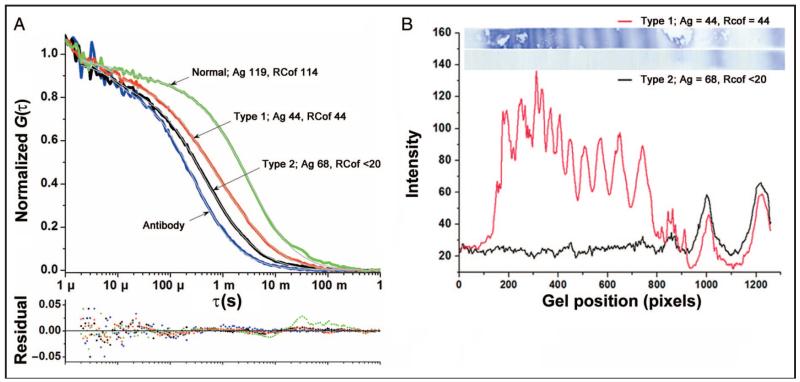
Fig. 3. Comparison of representative type 1 and type 2 samples.
(A), Owing to the differences in multimer distribution, the FCS curve from a sample with type 1 vWD (red) is shifted to the right compared to a sample with type 2 vWD (black), despite the lower vWF:Ag concentration of the type 1 vWD sample. Both lie between a representative normal sample (green) and antibody alone (blue). (B), Multimer gels (top) show marked differences in multimer size distribution, which correspond qualitatively to activity differences. Densitometry of these samples, however, does not yield values that correspond to differences in total antigen despite being run on the same gel, a common limitation of multimer gel electrophoresis (type 1/type 2 background subtracted total intensity ratio = 2.7, differs from vWF:Ag ratio = 0.6).

