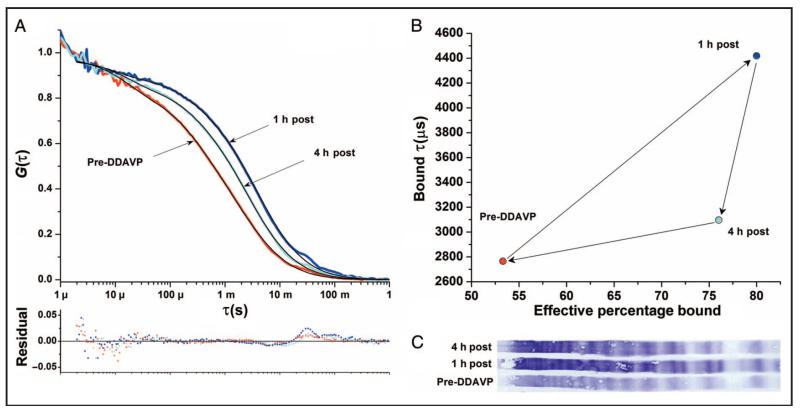
Fig. 5. FCS analysis of DDAVP trial in a type 1 vWD patient.
(A), FCS curve shows a marked shift to longer diffusion time 1 h post-DDAVP (post). After 4 h, the FCS curve shows a partial return toward baseline. The FCS curves and residuals show a bump at long τ due to large particles that become more pronounced in the samples post-DDAVP. (B), Two-component fit analysis at 1 h is consistent with the release of primarily large multimers, with an increase in both calculated total quantity and mean multimer size on the basis of mean bound diffusion time. At 4 h, the fit suggests the breakdown of large multimers, with a decrease in the mean bound diffusion time but less decrease in the percentage of antibody bound. (C), The corresponding multimer gel containing these 3 samples is shown for comparison. Traditional testing values for these samples were (Ag/RCof/FVIII): pre-DDAVP = 48/48/69, 1 h = 115/165/151, 4 h = 83/105/109.

