
Figure 4. Uranium immobilization restricted to the top of the biofilm.
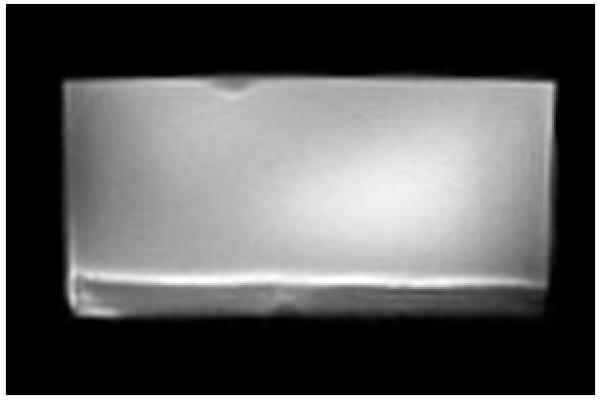
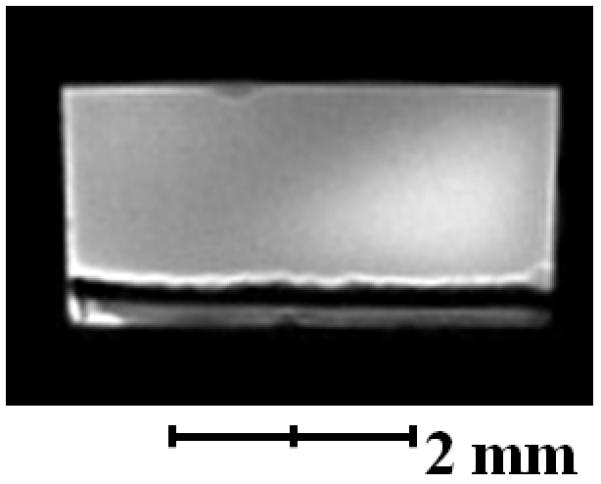

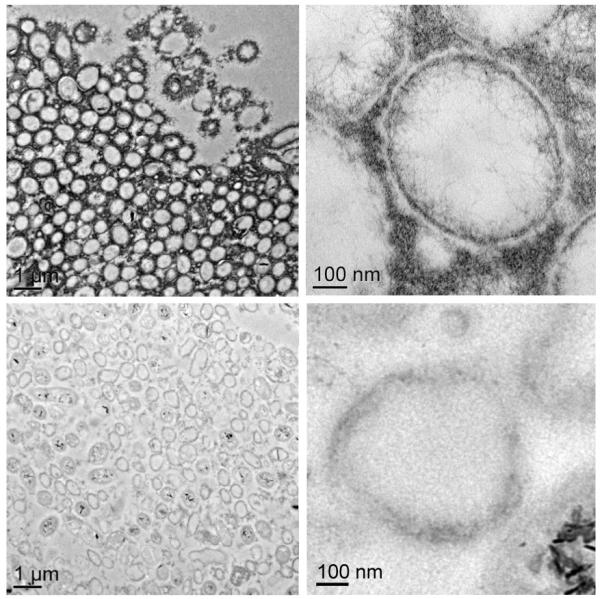
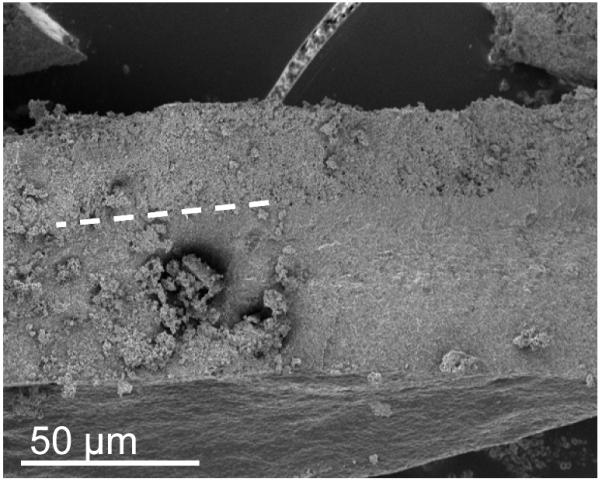

a, Axial view 2D MRI taken before UVI addition b, Axial view 2D MRI after two days of UVI addition. c, Overlay of relative diffusion coefficient profile (yellow), 2D MRI signal intensity (grey), and relative acetate concentration (black), after the addition of UVI. d, TEM image of a cross section of the biofilm. Top images: top of the biofilm after UVI addition, corresponding to the dark band seen in the 2D MRI. Biogenic reduced UVI can be seen precipitated onto strand-like formations encasing the cells. Bottom images: cells near the base of the biofilm. No UVI precipitates can be observed. However, cells appeared damaged and plasmolyzed, corroborating evidence that the base of the biofilm was electron donor and nutrient limited. e, SEM image of a biofilm cross section. The smooth bottom surface is shown, having been detached from the gold electrode. The white dashed line emphasizes the partition of the UVI-encrusted (top) and UVI-absent regions of the biofilm. f, EDS spectrum of the upper portion of the biofilm, revealing cells encrusted in material containing U and P. The background Cu peak is caused by the electrons scattered from the Cu TEM grid.