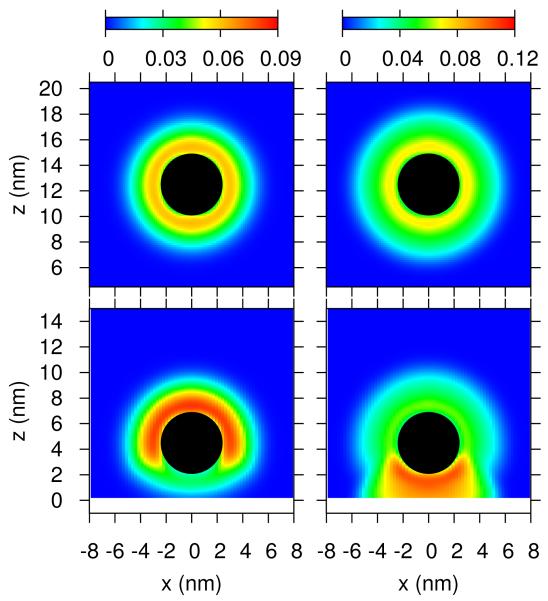
Figure 4.
Contour maps of the polymer segment volume fractions for both polybase and PEG for a micelle far and close to the lipid membrane. The left column correspond to the segment volume fraction of PEG polymer chains, while the right column corresponds to segment volume fraction of the polybase. The conditions correspond to the blue curve in Figure 2B. The black sphere denotes the core of the micelle.

