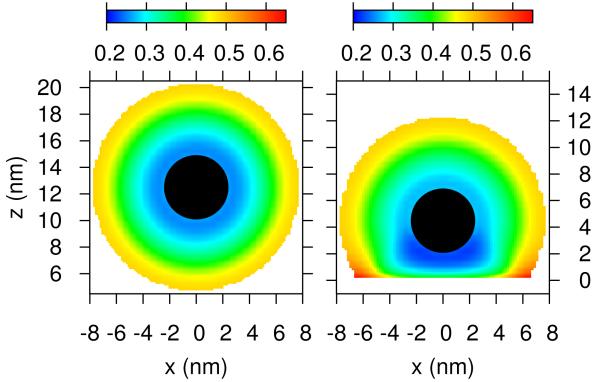
Figure 5.
Contour maps of the fraction of charged groups in the polybases for a micelle far (left map) and close (right map) to the lipid membrane. The distance z is measured from the lipids surface. The conditions correspond to the blue curve in Figure 2B.

