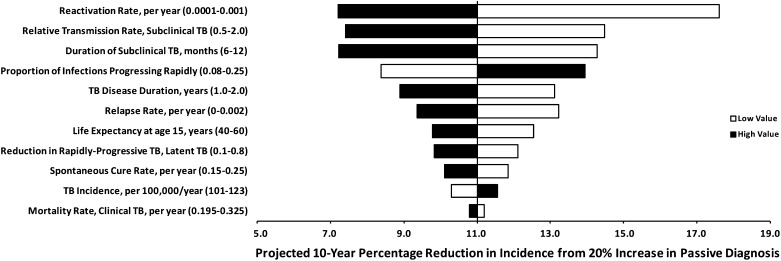
Figure 4.
One-way sensitivity analysis: epidemiologic impact of improved passive diagnosis. Bars represent the 10-year percentage reduction in incidence after improving passive case detection and treatment by a factor of 20% under the baseline scenario (subclinical phase 9 mo; prediagnostic phase 4.5 mo; clinical phase 4.5 mo), with the vertical line at 11% reduction representing the reference scenario in Table 2. Solid bars denote variation of the corresponding parameter to its high value in Table 1, open bars to the low value. Parameters to which the model is most sensitive appear at the top of the diagram. The corresponding analysis for enhanced diagnosis is similar in the rank-ordering of parameters’ importance; active diagnosis is less sensitive to the duration or relative transmission rate of subclinical tuberculosis (TB).

