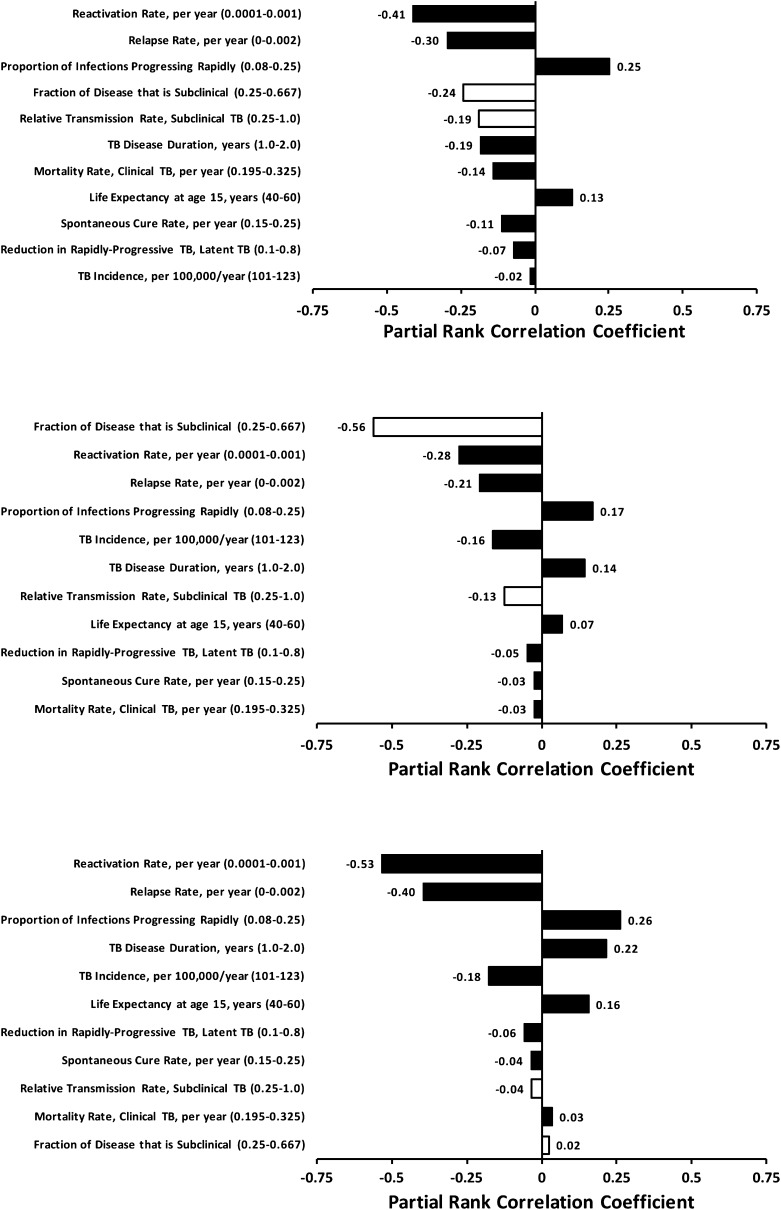
Figure 5.
Multivariable sensitivity analysis. Partial rank correlation coefficients (shown on the x axis) describe the degree of correlation between the corresponding parameter and 10-year reduction in tuberculosis (TB) incidence for passive (top), enhanced (middle), and active (bottom) diagnostic strategies after adjustment for the effects of other parameters in the model. Larger bars (i.e., parameters appearing at the top of each diagram) suggest that the outcome is more sensitive to the corresponding parameter value. Open bars correspond to those parameters that describe the subclinical infectious phase.

