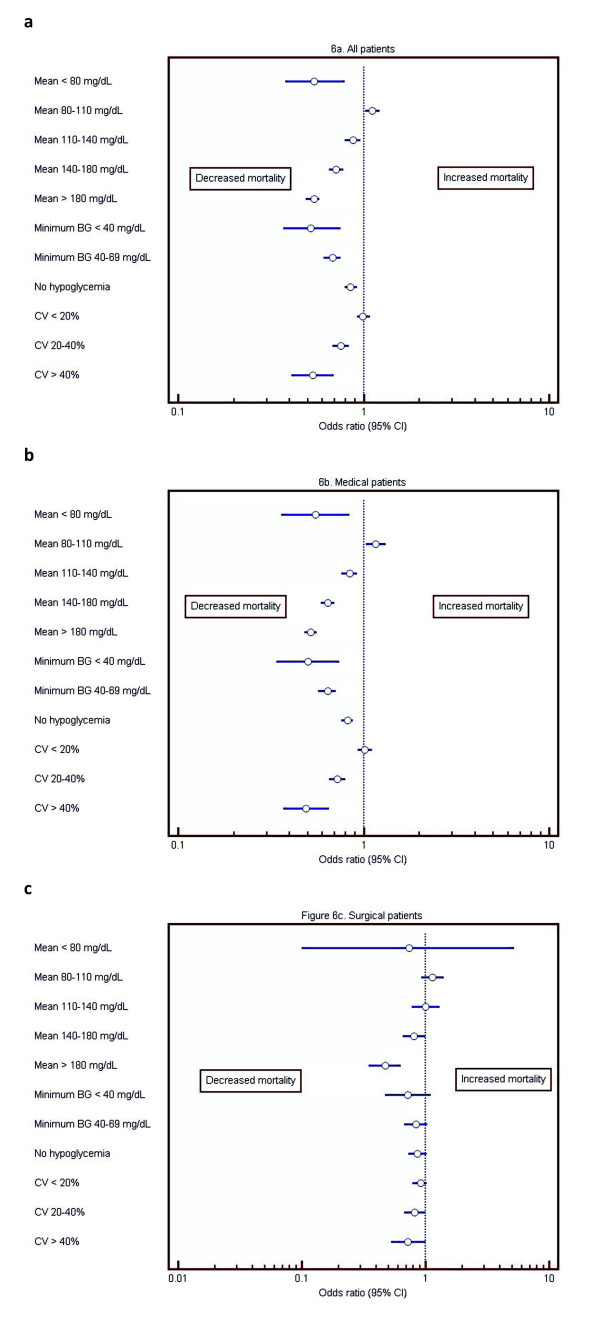
Figure 6.
Forest plots describing the independent association of diabetes with mortality, for each of the three domains of glycemic control. This figure illustrate the independent association of diabetic status with mortality associated with each of the three domains of glycemic control. For example, Figure 6a demonstrates that, among patients with mean BG 80 to 110 mg/dl, diabetes was independently associated with increased risk of mortality, but among patients with mean BG of 110 to 140 mg/dl, diabetes was independently associated with decreased risk of mortality.

