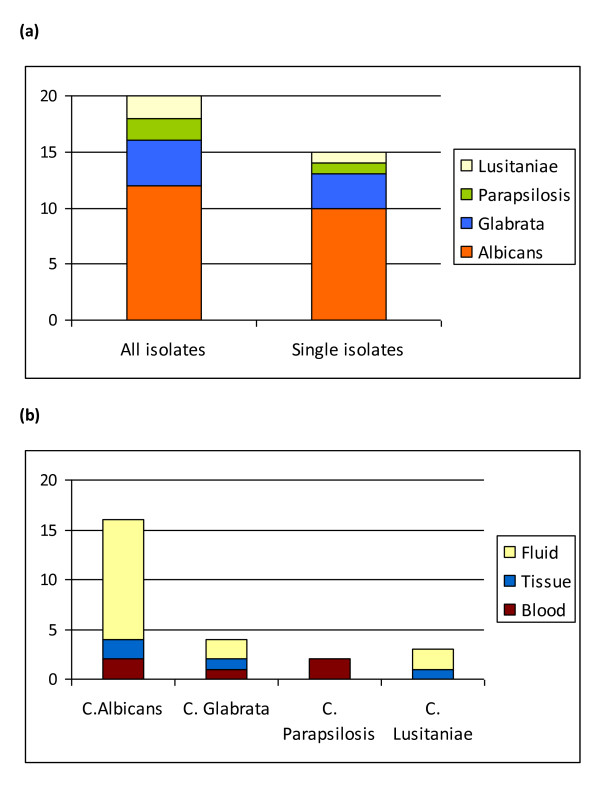
Figure 2.
Candidal species isolated. (a) The number of candidal species isolated from patients. The left hand bar shows the contribution of candidal species isolated from patients, including mixed growth; the right hand bar shows single isolates only. (b) The proportion of each candidal species cultured from all positive isolates in patients classified as infected with candida.

