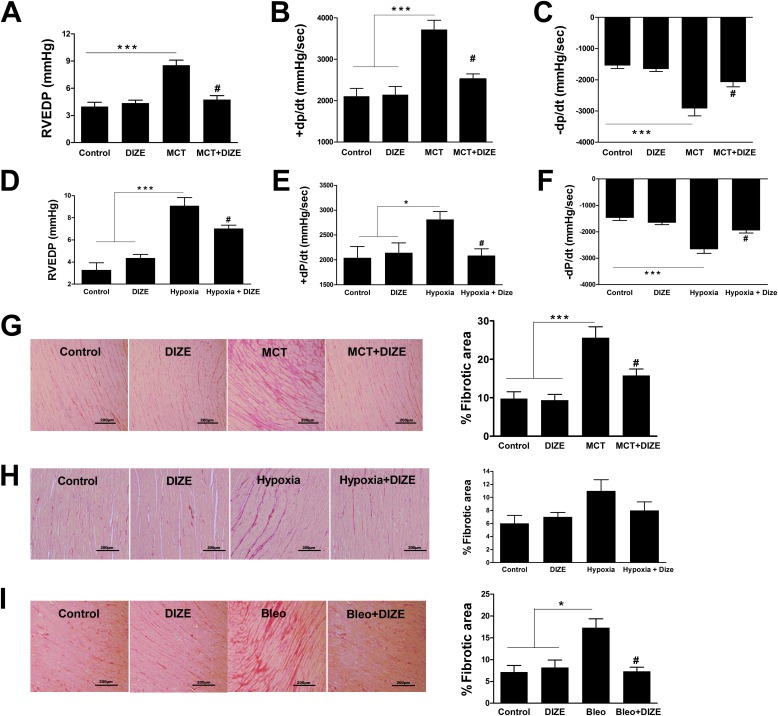
Figure 2.
Attenuation of pulmonary hypertension (PH)-induced right ventricular dysfunction and cardiac fibrosis. Measurement of (A) right ventricular end diastolic pressure (RVEDP), (B) +dP/dt, and (C) −dP/dt in the monocrotaline (MCT) model of PH. Similar measurements of (D) RVEDP, (E) +dP/dt, and (F) −dP/dt in the hypoxia model of PH. (G) Collagen staining and quantitative analysis of right ventricular fibrosis from the MCT study. (H) Quantification of right heart fibrosis from the hypoxia study. (I) Representative picrosirius red–stained sections and quantitative analysis of myocardial fibrosis from the bleomycin study. Data represent mean ± SEM. *P < 0.05 and ***P < 0.001 compared with control rats or the DIZE-alone group. #P < 0.05 compared with MCT/hypoxia/bleomycin-challenged rats. +dP/dt and −dP/dt refer to rate of change in ventricular pressure with respect to time and characterize the systolic and diastolic function of the right ventricle, respectively. Scale bars: 200 μm.

