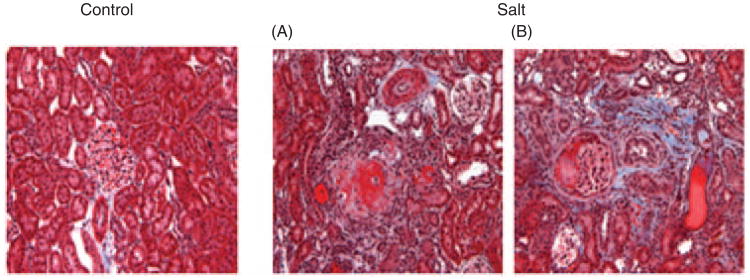
Figure 3.
Renal light micrographic images showing changes in kidneys in salt-loaded rats. Left: SHR control rat; right: fibrinoid necrosis of afferent arterioles, with an ‘onion skin’ appearance (A), tubular cast, and interstitial fibrosis (B) can be seen in salt-loaded rats (Masson trichrome staining; × 200 original magnification).

