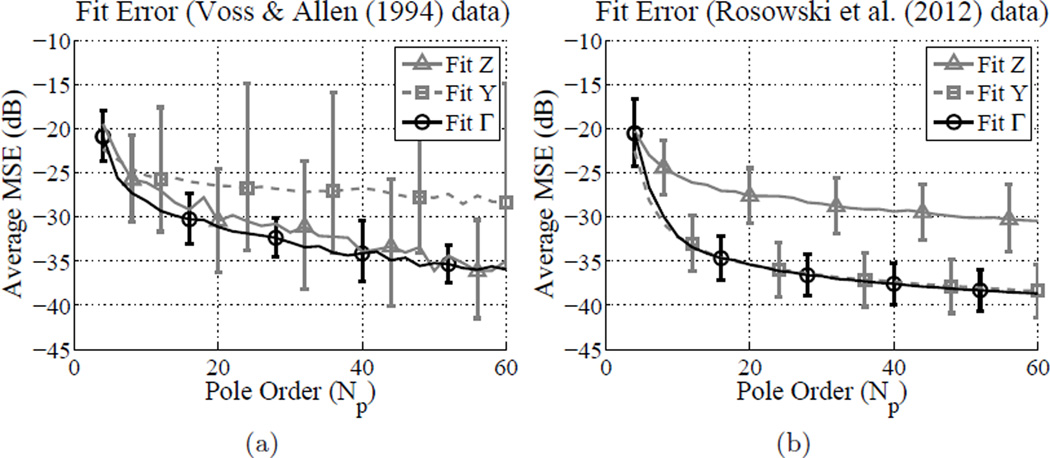
Figure 3.
Fit error evaluation across the Z, Y and Γdomains for different data sets (18 iterations). Lines show the average MSE (dB) for each domain, with error bars indicating one standard deviation. (a) 14 measurements of normal ears (Voss and Allen, 1994) fit over the 0.1 to 10 kHz range, (b) 112 measurements of normal ears (Rosowski et al., 2012) fit over the 0.2 to 6 kHz range.

