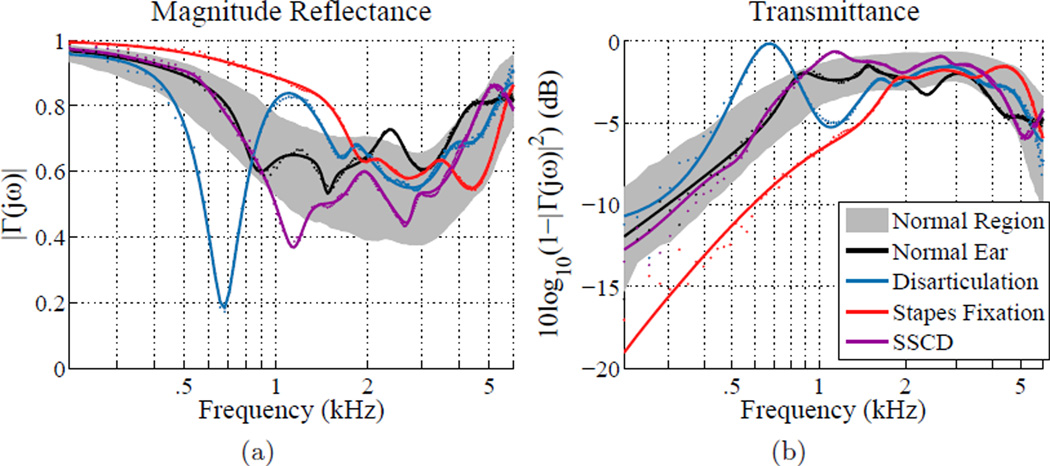
Figure 7.
A comparison of normal and pathological ears. (a) Power reflectance |Γ(jω)|2, (b) transmittance level (dB). Grey region shows the normative region for the Rosowski et al. (2012) study of normal ears (±1 standard deviation). The black data points and line show the data and fit for normal ear 22L of Rosowski et al. (2012). The blue, red, and purple show the data and fit for stapes fixation ear 62L, disarticulation ear 28L, and SSCD ear 52L of Nakajima et al. (2012).

