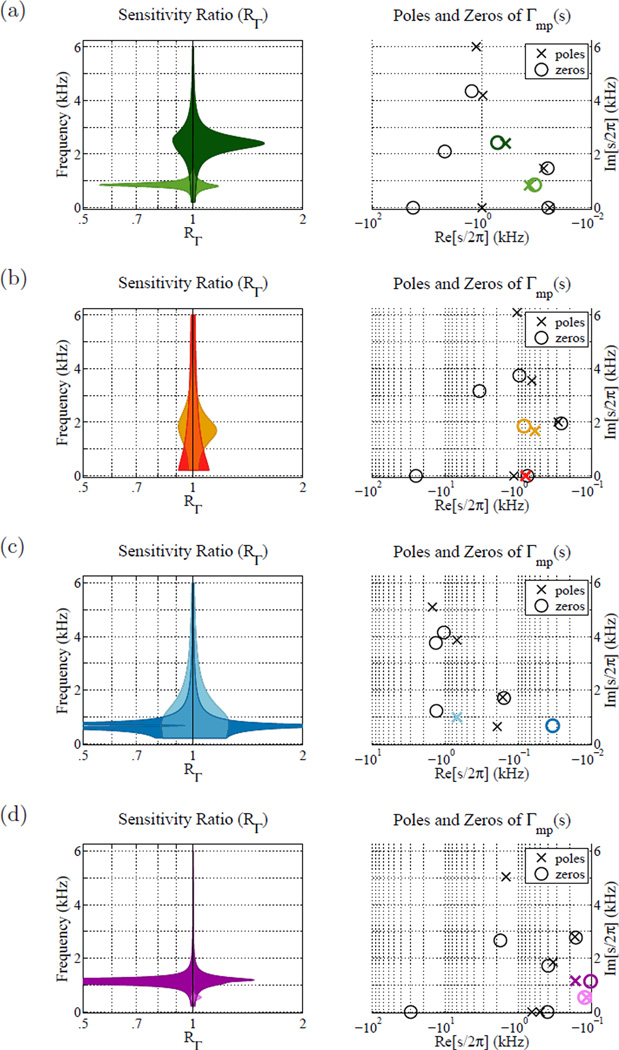
Figure 8.
Sensitivity analysis of poles and zeros for the ears shown in Fig. 7. Each subplot shows the pole-zero plot Γmp(s) of the fit (left), and the corresponding sensitivity analysis of the highlighted poles (right). The sensitivity analysis represents a ratio of modified reflectance magnitude |Γ(jω)| to the original fit, given a slight variation in the location of the highlighted pole, zero, or pole-zero pair. Each sensitivity plot shows two different color-coded analyses. Notice that the frequency axes are aligned for each pair of plots. (a) Normal ear, (b) stapes fixation, (c) disarticulation, (d) SSCD.

