
Figure 2.
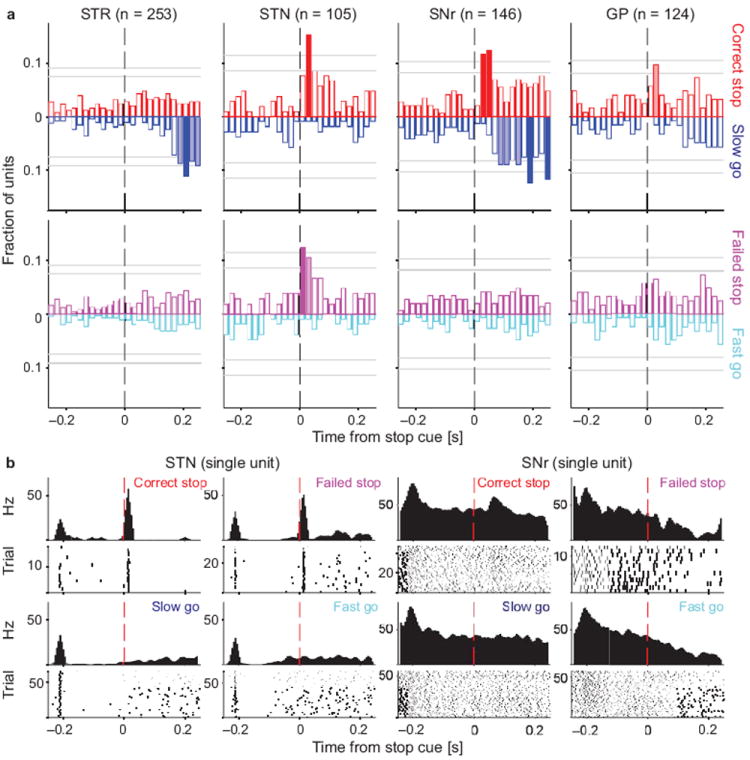
Distinct processing of the Stop cue across basal ganglia components. (a) For each brain area, bars indicate the fraction of neurons whose firing rate significantly differs between the trial types under comparison. To screen for Stop-related activity, we compared Correct Stop trials with Slow Go trials (top), and Failed Stop trials with Fast Go trials (bottom). For example, movement-related activity is very similar on Fast Go and Failed Stop trials, so it does not show up in this comparison. Activity is aligned on Stop cue onset (or for Go trials, the point at which the Stop signal would have been presented had it been a Stop trial). Upwards bars denote the fraction of units that fired more on Stop trials; downward bars denote the fraction of units that fired more on Go trials. Filled bars indicate times when this fraction significantly exceeded chance level (binomial test; p < 0.05 with pale bars uncorrected and dark bars corrected for multiple comparisons; horizontal grey lines mark respective significance thresholds). All data shown are for contralateral Stop and Go trials (see Fig. S2 for ipsilateral trials and for a direct comparison of Correct and Failed Stop trials). (b) Illustrative examples of individual neuron activity in STN and SNr during Go trials in the four relevant trial types as indicated (both ipsi- and contralateral movements are shown). The STN unit showed a fast, transient increase in activity after the Stop cue in both Correct and Failed Stop trials. On Correct Stop trials the SNr unit also showed a fast increase in firing, and no movement-linked pause. By contrast, on Failed Stop trials the SNr unit simply showed a movement-linked decrease in firing rate and no response to the Stop cue, very similar to Fast Go trials.