
Figure 5.
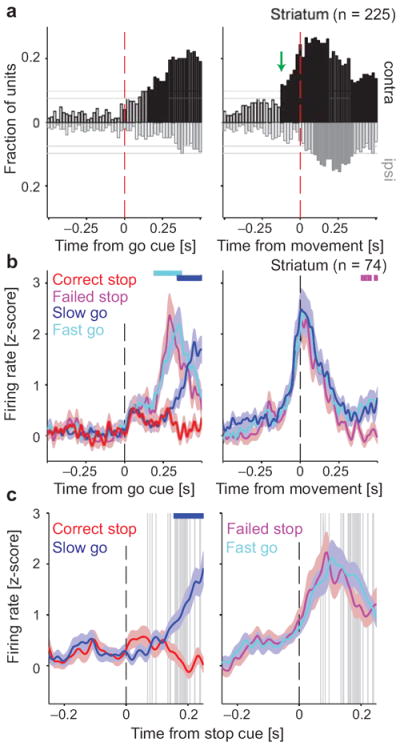
Variable timing of a striatal Go process critically determines whether stopping is successful. (a) Fractions of striatal units distinguishing between contra- and ipsilateral movements, at each time point during Go trials. Layout is as Fig. 2. On right, the black solid bars before the red dashed line indicate significant coding of movement direction before movement onset. The 74 units that contributed to these bars were considered potential contributors to a Go process (rat breakdown: 5, 23, 11, and 35 units from rats 10–13, respectively; see Tab. S1). For corresponding analysis of other brain regions, see Fig. S5. (b) Mean (± s.e.m.) firing rate z-score for these 74 striatal units (see Fig. S6 for activity separated by cell type). Cyan bar at the top indicates times with significantly different firing rates on Fast vs. Slow Go trials, blue bar indicates the same for Slow Go vs. Correct Stop trials, and purple bar for Fast Go vs. Failed Stop trials (shuffle test, p < 0.05, corrected for multiple comparisons). (c) Activity of the same striatal units aligned to the Stop cue. Note the different time scale than in (b). Format is as Fig. 3a.