
Figure 6.
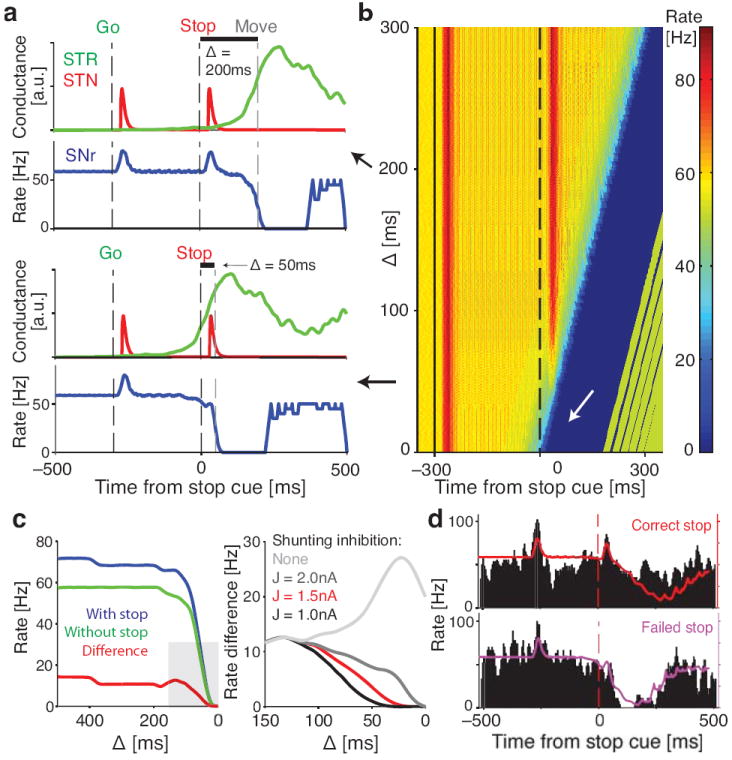
Modeling sensorimotor gating in SNr neurons. (a) Model responses for two illustrative values of Δ, the interval between Stop cue and Move onset. Red and green lines indicate STN and striatal (STR) inputs to the SNr model, and blue line shows the output firing rate of the model SNr cell. Note the clear SNr response to the Stop cue with Δ = 200ms, but not with Δ = 50ms. (b) SNr model responses to the Stop cue over a range of Δ. For small Δ, strong shunting inhibition from striatum prevents STN-evoked spiking to the Stop cue (white arrow). (c) (left) Comparison between model output with and without Stop cue, measured in the 50 ms after STN input reaches SNr. (right) Enlarged view of the grey area, for the range of Δ where Stop cue gating occurs. Red line is the same as on the left panel, other lines show the effects of different levels of shunting inhibition. In all cases the lines indicate the difference between model SNr firing rate with and without the Stop cue. Note that without shunting inhibition the model does not gate the Stop cue as observed in the experimental SNr data. (d) Model SNr output (colored lines) exhibits response to the Stop cue in Correct Stop trials (top) but not in Failed Stop trials (bottom). Failed and Correct Stop trials in the model are based on rat reaction time data (see Fig. S7). Black histogram shows one example rat SNr cell for qualitative comparison to the model. Note that in the model, increased firing to the Stop cue response was always followed by a movement-related decrease as, for simplicity, we did not incorporate our observation that striatal output is subsequently suppressed on Correct Stop trials (Fig. 5b,c; see Discussion).