
Figure 5.
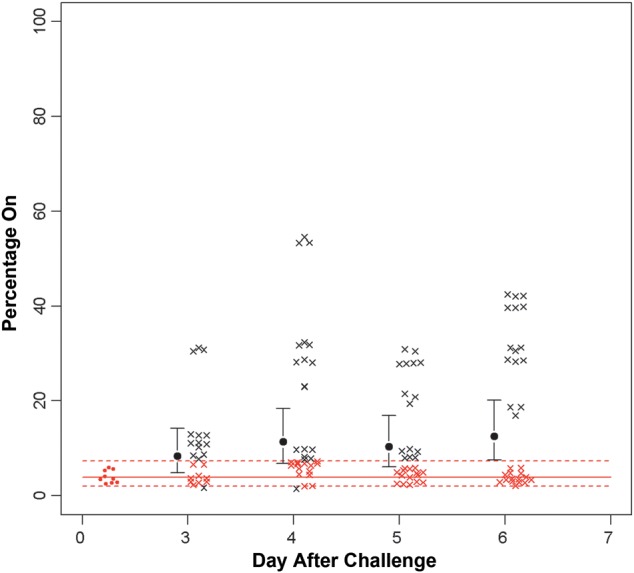
Results of capillary electrophoresis analysis of phase variation of iga during the colonization period. The solid red line is the mean phase on in the inoculation samples, and the dotted lines represent the 95% confidence intervals. The majority of samples within the inoculation strain (day 0) are phase off. As can be seen, there is a progressive shift in the samples to phase on, and by day 6 this difference is significant. The red open circles indicate the percentage phase on in the inoculation strain. Each black × represents a sample outside of the 95% confidence interval of the inoculation strain, while each red × represents a sample within that interval.