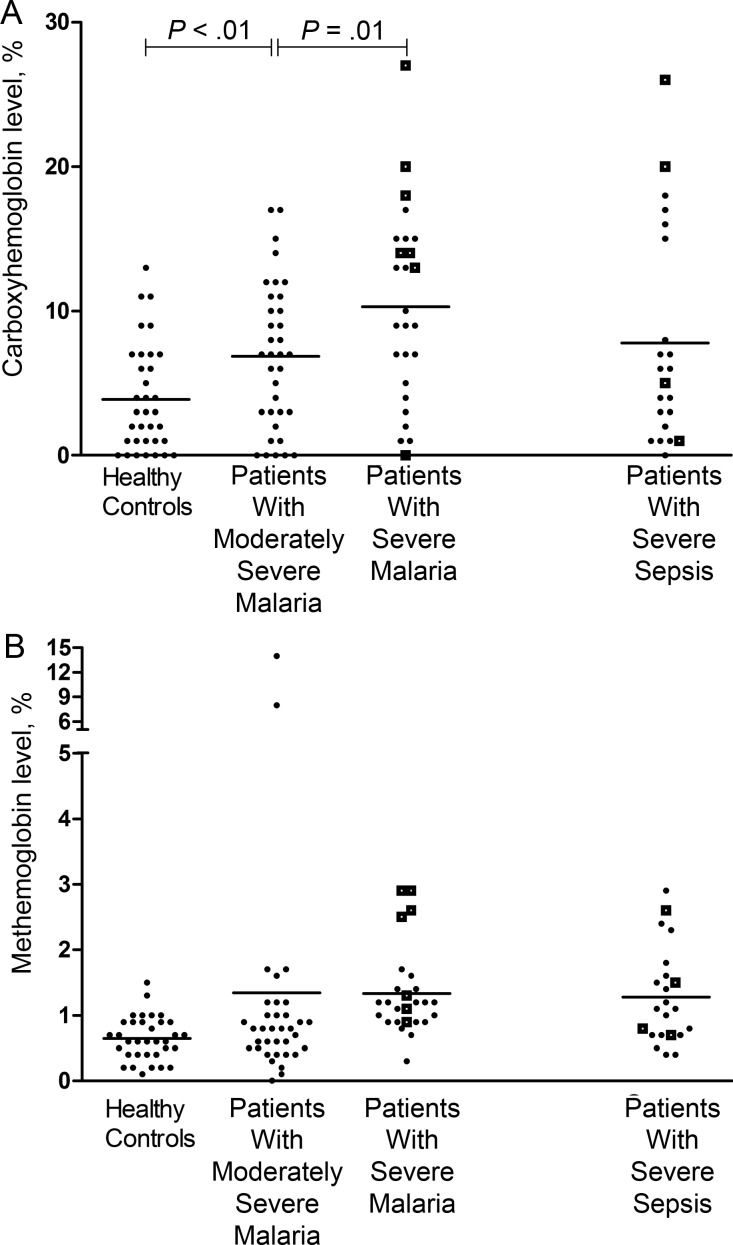
Figure 1.
A, Carboxyhemoglobin levels in healthy controls, patients with moderately severe malaria, patients with severe malaria (P < .001, by analysis of variance), and patients with severe sepsis. Open squares represent fatal cases, and horizontal lines represent mean values for each group. Horizontal bars represent pairwise comparisons between disease groups. B, Methemoglobin levels in healthy controls, patients with moderately severe malaria, patients with severe malaria, and patients with severe sepsis (P = .01, comparing all groups by the Kruskal-Wallis test). Open squares represent fatal cases, and horizontal lines represent the mean values for each group.

