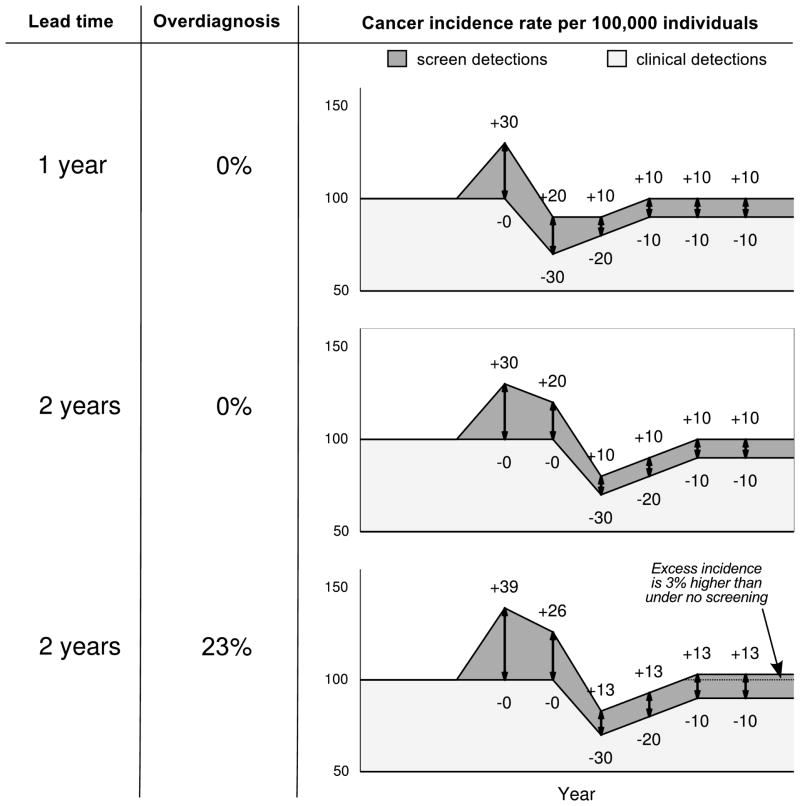
Figure 2.
Incidence trends following the introduction of screening in three scenarios with the same baseline incidence (constant 100 cases per 100,000 individuals per year), disease prevalence, test sensitivity, and screening test dissemination. (1) Lead time equals 1 year, no overdiagnosis. (B) Lead time equals 2 years, no overdiagnosis (c) Lead time (among non-overdiagnosed cases) equals 2 years, 3 screen-detected cases overdiagnosed per 13 screen-detected cases (23%). In each panel, the number of cases per 100,000 screen-detected each year is preceded by a plus sign. The number of deficits in incidence each year, due to earlier detection by screening, is preceded by a minus sign.

