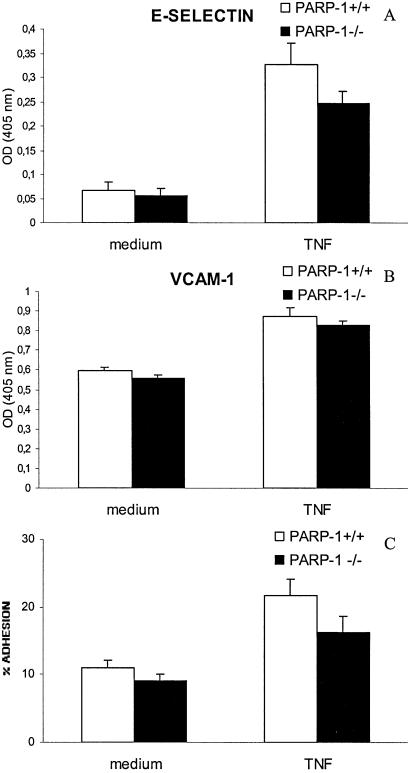
Figure 3.
Cell surface expression of E-selectin (A) and VCAM-1 (B) in both PARP-1+/+ (white bars) and PARP-1–/– (black bars) endothelial cells in response to 6 h TNF-α treatment (20 ng/ml). ELISAs were performed on fixed cells. Absorbencies measured at 405 nm are plotted in the y-axis. A representative of three experiments is shown. (C) Cell adhesion of activated murine splenocytes to TNF-α-activated PARP-1+/+ (white bars) and PARP-1–/– (black bars) endothelial cells. Error bars indicate standard error.

