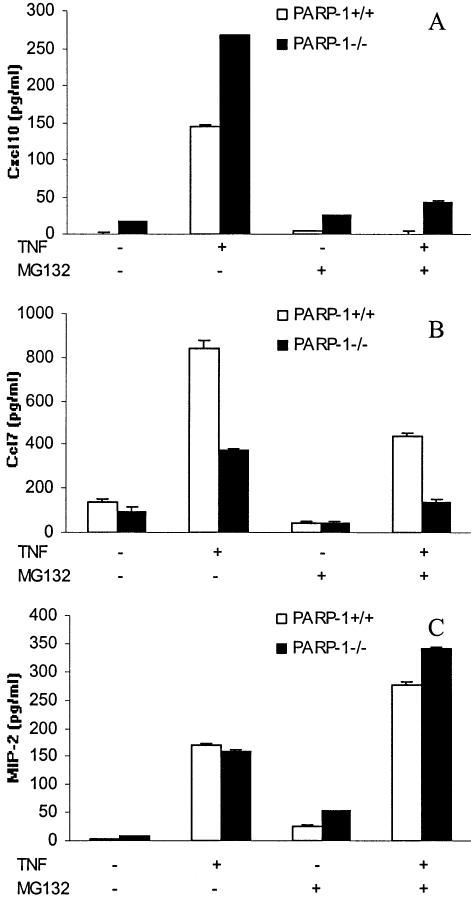
Figure 6.
TNF-α-induced chemokine production in both PARP-1+/+ (white bars) and PARP-1–/– (black bars) endothelial cells. MHECs were stimulated for 24 h (A and C) or 6 h (B) with 20 ng/ml TNF-α, in the presence or absence of MG132. The levels of Cxcl10 (A), Ccl7 (B) and MIP-2 (C) chemokines were measured by ELISA. A representative of three experiments is shown. Error bars indicate standard error.

