
Figure 2.
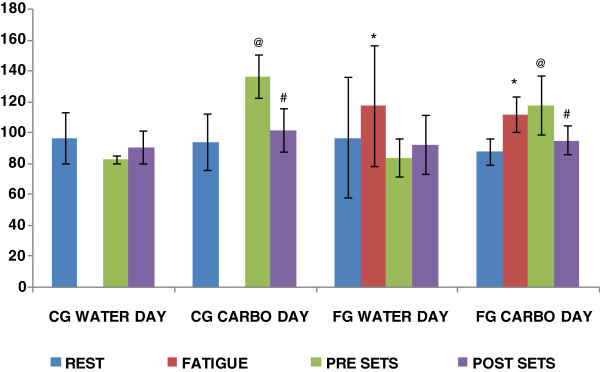
Glucose data (mg/dl) for CG and FG for both days. * p < 0.05 comparing FATIGUE to REST within the group on both days. @ p < 0.05 comparing PRE SETS to REST within the group for all groups on both days. # p < 0.05 comparing POST SETS to PRE SETS within the group for all groups on both days.