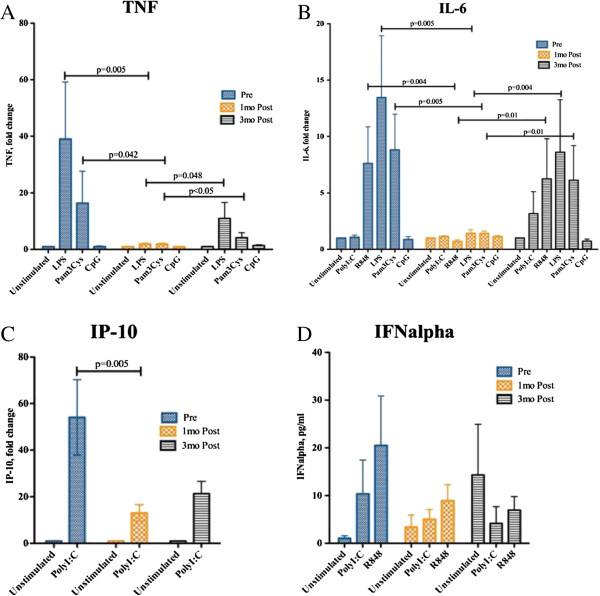
Figure 3.
Cytokine concentrations upon stimulation with TLR specific ligands, as measured at baseline, 1 and 3 months post start of vitamin D supplementation. PBMCs were stimulated with TLR ligands LPS (TLR4), Pam3Cys (TLR2), CpG (TLR9) for 24 hours and supernatants were assayed by cytokine ELISA for TNF (Figure 3A) and IL-6 (Figure 3B). Results were expressed as fold change compared to unstimulated PBMCs. In Figures 3C and 3D, PBMCs were stimulated with TLR ligands PolyI:C (TLR3) and R848 (TLR7/8) and supernatants were assayed by ELISA for IP-10 (Figure 3C) and IFNalpha (Figure 3D). Results were expressed by fold change for Figure 3C and absolute values for Figure 3D.

