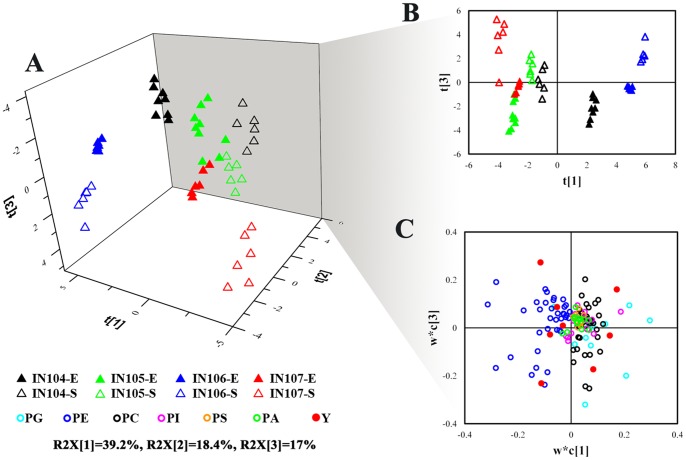
Figure 5. PLS-DA model based on the entire phospholipid profile in C. sorokiniana.
(a) PLS-DA 3D score plot distinguishing C. sorokiniana grown under different inoculum sizes (R2X [1] = 39.2%; R2X [2] = 18.4%; R2X [3] = 17%). (b) PLS-DA score plot t [1]–t [3] indicating the separation between different groups; (c) PLS-DA loading plot w*c [1]−w*c [2] explaining the separation above.

