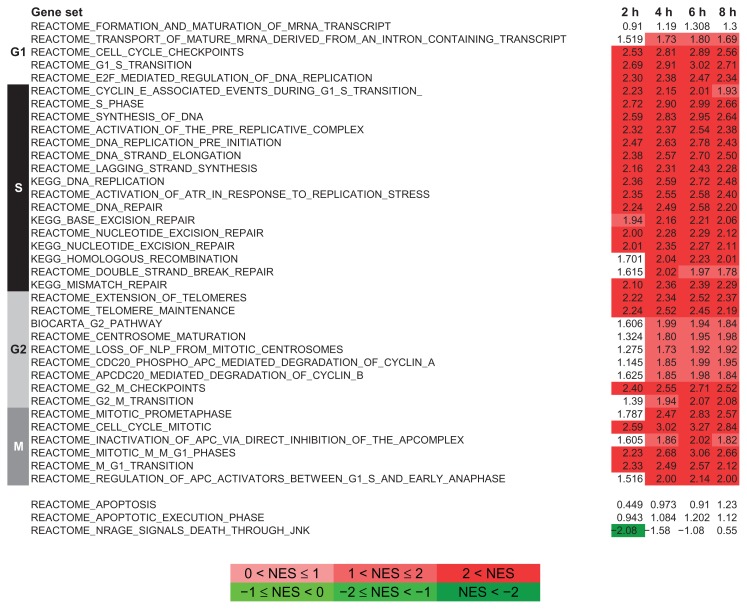
Figure 4.
Gene set enrichment analysis (GSEA) of gene sets associated to canonical pathways. Gene lists were built to represent the onset of proliferation upon release from the INH treatment and ranked according to the t-statistic from the results of the limma analyses. Gene sets were grouped according to the cell cycle phase to which they were associated. The last 3 gene sets in the list were associated to cell death. The Normalized Enrichment Score (NES) is shown. The red (positive NES) and green (negative NES) scales mark the FDR q-val scores with significances below 0.05.

