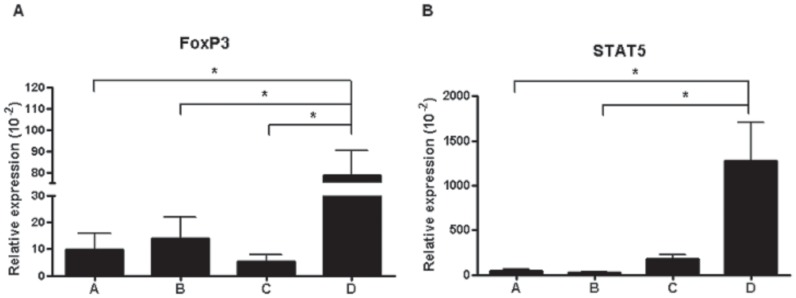
Figure 5. Foxp3 and STAT5 expression profiles.
(A) Foxp3 expression in the combination cell therapy group was increased significantly compared to that in the other groups. (B) STAT5 expression in the combination cell therapy group was increased significantly compared to that in other groups. *p<0.05.

