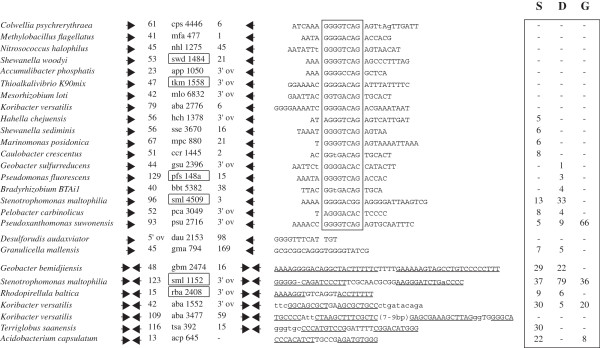
Figure 9.

TIRYT genes. TIRs flanking TIRYT genes are diagrammed as arrows. Distances in bp separating genes and TIRs are shown, 5′ov and 3′ov refer to overlapping flanking sequences as in Figure 8. Only upstream TIR sequences are shown. Lower case letters denote non complementary TIR residues. ORFs shown in Figure 8, and conserved GGGGWSAS motifs, are boxed. Complementary residues in the double palindromic TIRs shown at the bottom are underlined. Boxed numbers to the right refer to single (S), dimeric (D) or grouped (G) TIR sequences found in the indicated genomes.
