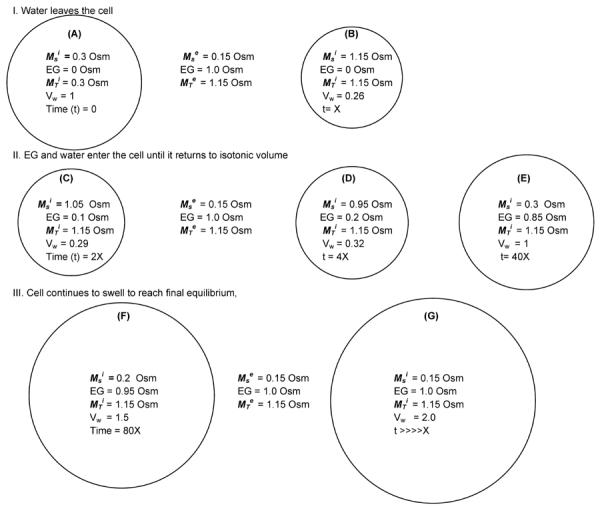
Fig. 1.

Schematic of changes in the osmolalities of water and solutes and in the volume of water in a cell abruptly transferred from isotonic (0.3 osmolal) PBS to a solution of 1 osmolal ethylene glycol (EG) in hypotonic salt (0.15 osmolal). The cell is assumed to be permeable to the former but impermeable to the later. The superscripts i and e refer to inside and outside the cell, Ms and MT are the osmolalities of salt and the total osmolality (salt + EG). Vw is the volume of water in the cell relative to its volume in an isotonic cell. The time scale is arbitrary except to indicate that the swelling process in C–G is much slower than the shrinking process in A to B. The circles represent the variations in cell size but are not drawn quantitatively to scale.
