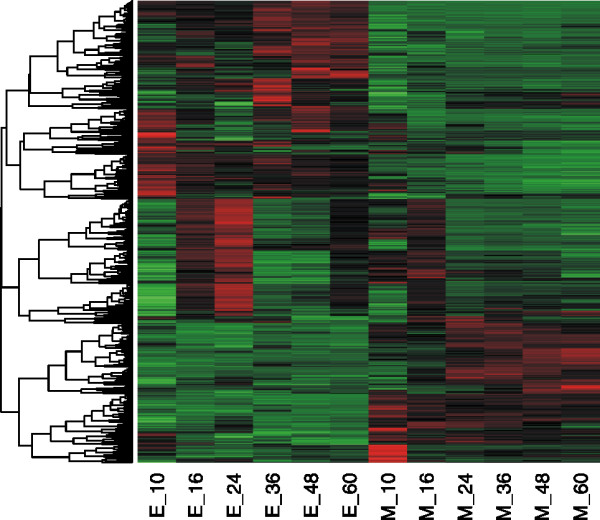
Figure 2.

Heatmap of the 1500 differentially expressed genes between NRRL23338 and E3. Red = up-regulated, Green = down-regulated, the dendrogram on the left is the clustering result, the sample names (M: model strain NRRL23338, E: high-producing strain E3, the number represents the time point) are list on the bottom.
