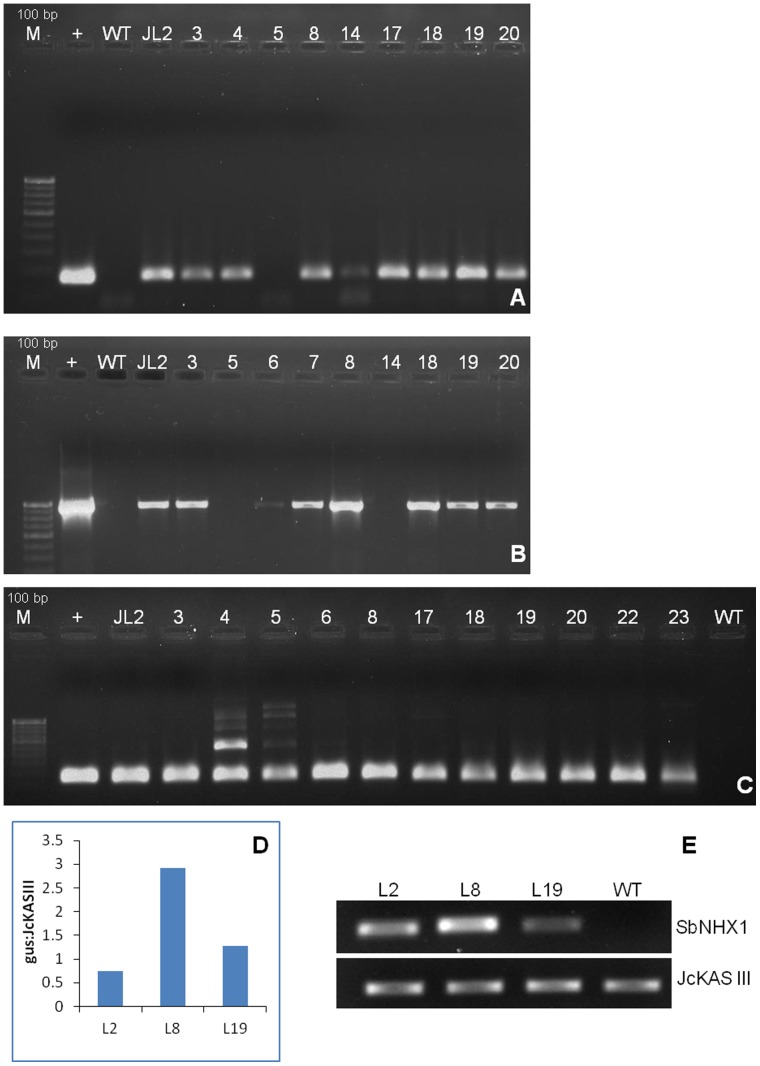
Figure 3. Molecular confirmation of transgenic Lines.
PCR amplification of (A) SbNHX1 gene (172 bp internal fragment), (B) hptII gene (963 bp) and (C) gus gene (157 bp internal fragment). Lane M is 100 bp Molecular weight marker ladder (Bangalore Genei, India); lane+is pCAMBIA1301-SbNHX1 (positive control). (D) Real time qPCR analysis to determine the ratio of gus to JcKASIII gene in transgenic lines. Three lines L2, L8 and L19 have a ratio of 0.74, 2.92 and 1.27, respectively. (E) Reverse transcriptase PCR of SbNHX1 transgenic lines. Amplification was observed in transgenic lines while there was no amplification from WT; JcKASIII gene was used as an internal control.

